
Continuing to try and figure out how to grab the data from the SDR it struck me I had a few pieces of the puzzle to complete.
- Can I actually capture the data using the SDR? Until I know for sure that the data is available then doing anything else seems a little premature.
- If I can see the data, can I decode it and does it look as the information I have found on the web implies it should?
- If I can do all that, can I figure out how to take those steps and put them into a simple long running daemon?
Another look at the available information suggested that the signal I was looking for had the following characteristics,
- 868Mhz - 868.5Mhz for the UK/EU
- FHSS - hops between 5 distinct frequencies for the UK/EU
- transmits data at 19,200 baud
- transmissions occur every 2.5 seconds
- Gaussian Frequency Shift Keyring data modulation
Having seen the 5 peaks on the spectrum analyzer before I was confident that the SDR could capture the transmissions, but this time I wanted to try and refine things a little.
I had already read that the SDR required oversampling and the code I had found suggested a multiplier of 14. Doing the simple maths (19,200 x 14 = 268,800) showed the resultant sample rate was good for the SDR ranges I found quoted online.
Setting the centre frequency to 868.3Mhz gave me an observed range of 868.3Mhz +/- 134kHz which I thought would cover at least one of the spread spectrum frequencies.
With the settings chosen I started collecting samples into a file for a long enough period that I should have a few transmissions to examine - 100 seconds.
During my research I had come across a tool called inspectrum that was demonstrated in use analysing a wireless signal, so I cloned it and built the app.
The raw samples are contained as 2 byte complex values (one byte real, one imaginary). inspectrum expects such files to have a .cu8 extension which wasn't immediately clear to me.
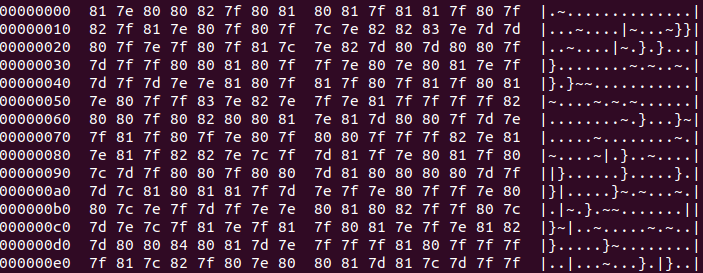
After adjusting the filename, it was possible to open the file and view the data.
./inspectrum iss_100.cu8

The initial screen wasn't inspiring, but then I am dealing with sparse data and only expect to be seeing data every 2.5 seconds. The screen doesn't cover that large a time range. Navigating the data was simple so as I moved through it it wasn't long before I found something more interesting.
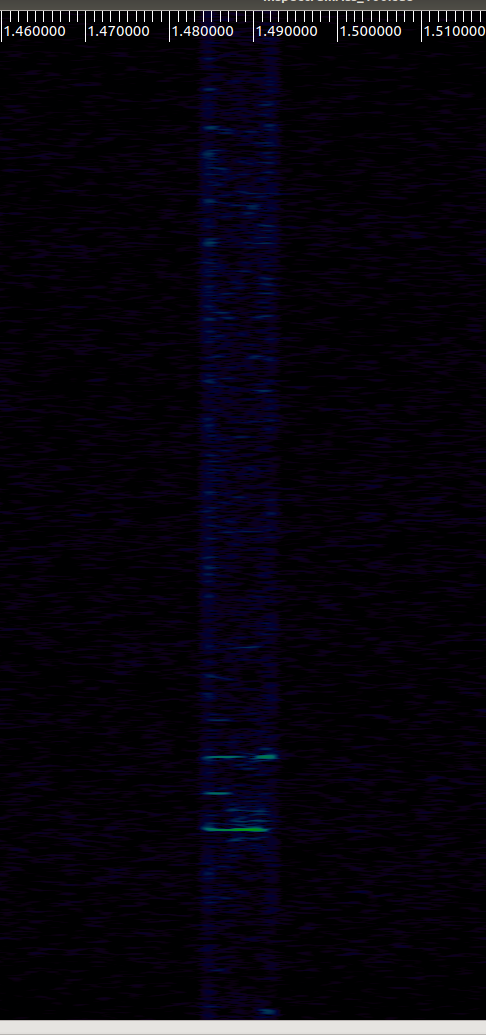
Given the range of possible frequencies and where I had asked the SDR to tune, this looked positive. It also gave me a time index to start looking for the next. And the next.
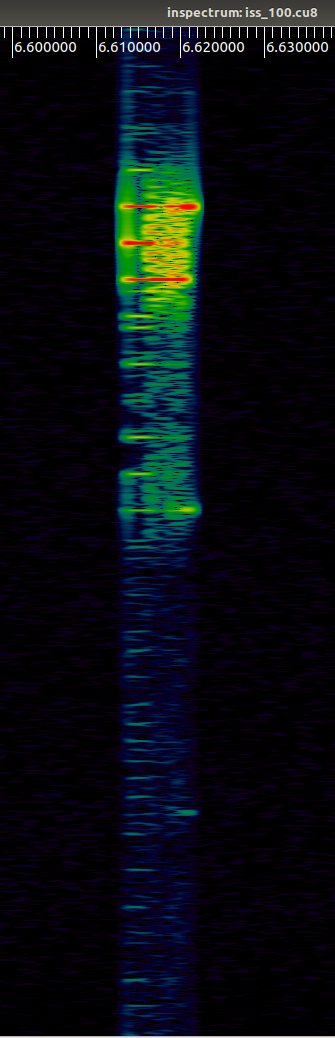
Just after 5 seconds after the initial burst I found this strong transmission. As the data is modulated I was expecting to see 3 strong bands, which this certainly has. The next step will be to try and analyze the data.