Before getting started I decided to grab the following binary data files from the device.
- Flash 0x08000000 - 0x08003FFF (256Kb) - flash.bin
- EEPROM 0x0808000 - 0x08081FFF (8Kb) - eeprom.bin
- SRAM 0x20000000-0x20007FFF (32Kb) - ram.bin
- System Memory 0x1ff00000-0x1FF01FFF (8Kb) - system_memory.bin
Each was accessed using 8-bit data width. Suitably equipped it was time to actually start examining them. I'm going into a bit of detail as to what I'm doing in the hope it will help someone else and more than likely future me... No doubt this will be old hat to many!
Ghidra Setup
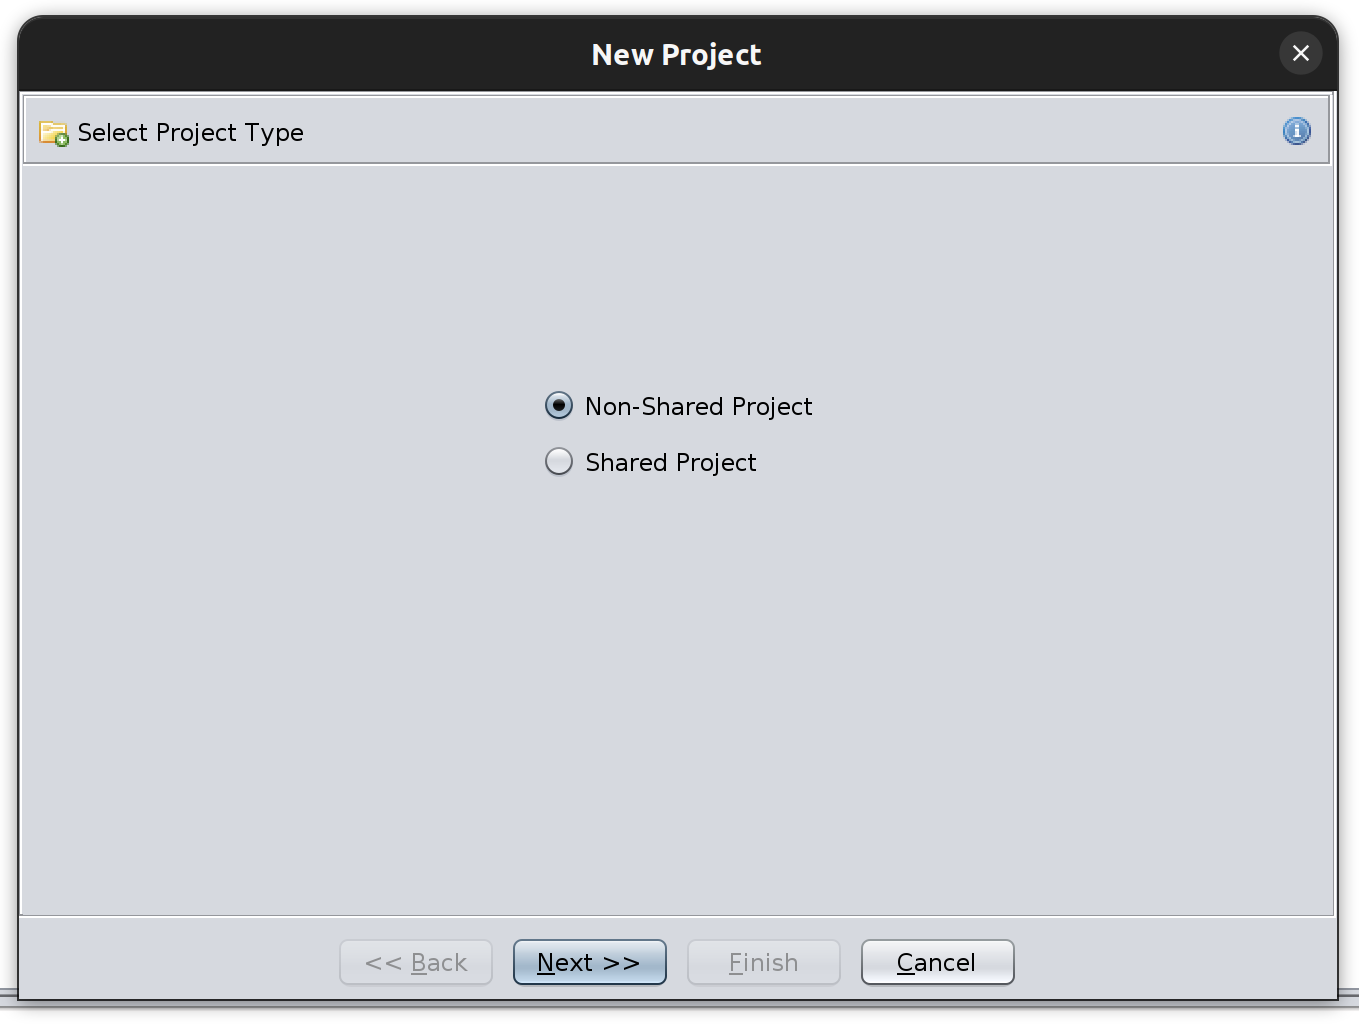
After opening Ghidra I started a new, non-shared project.
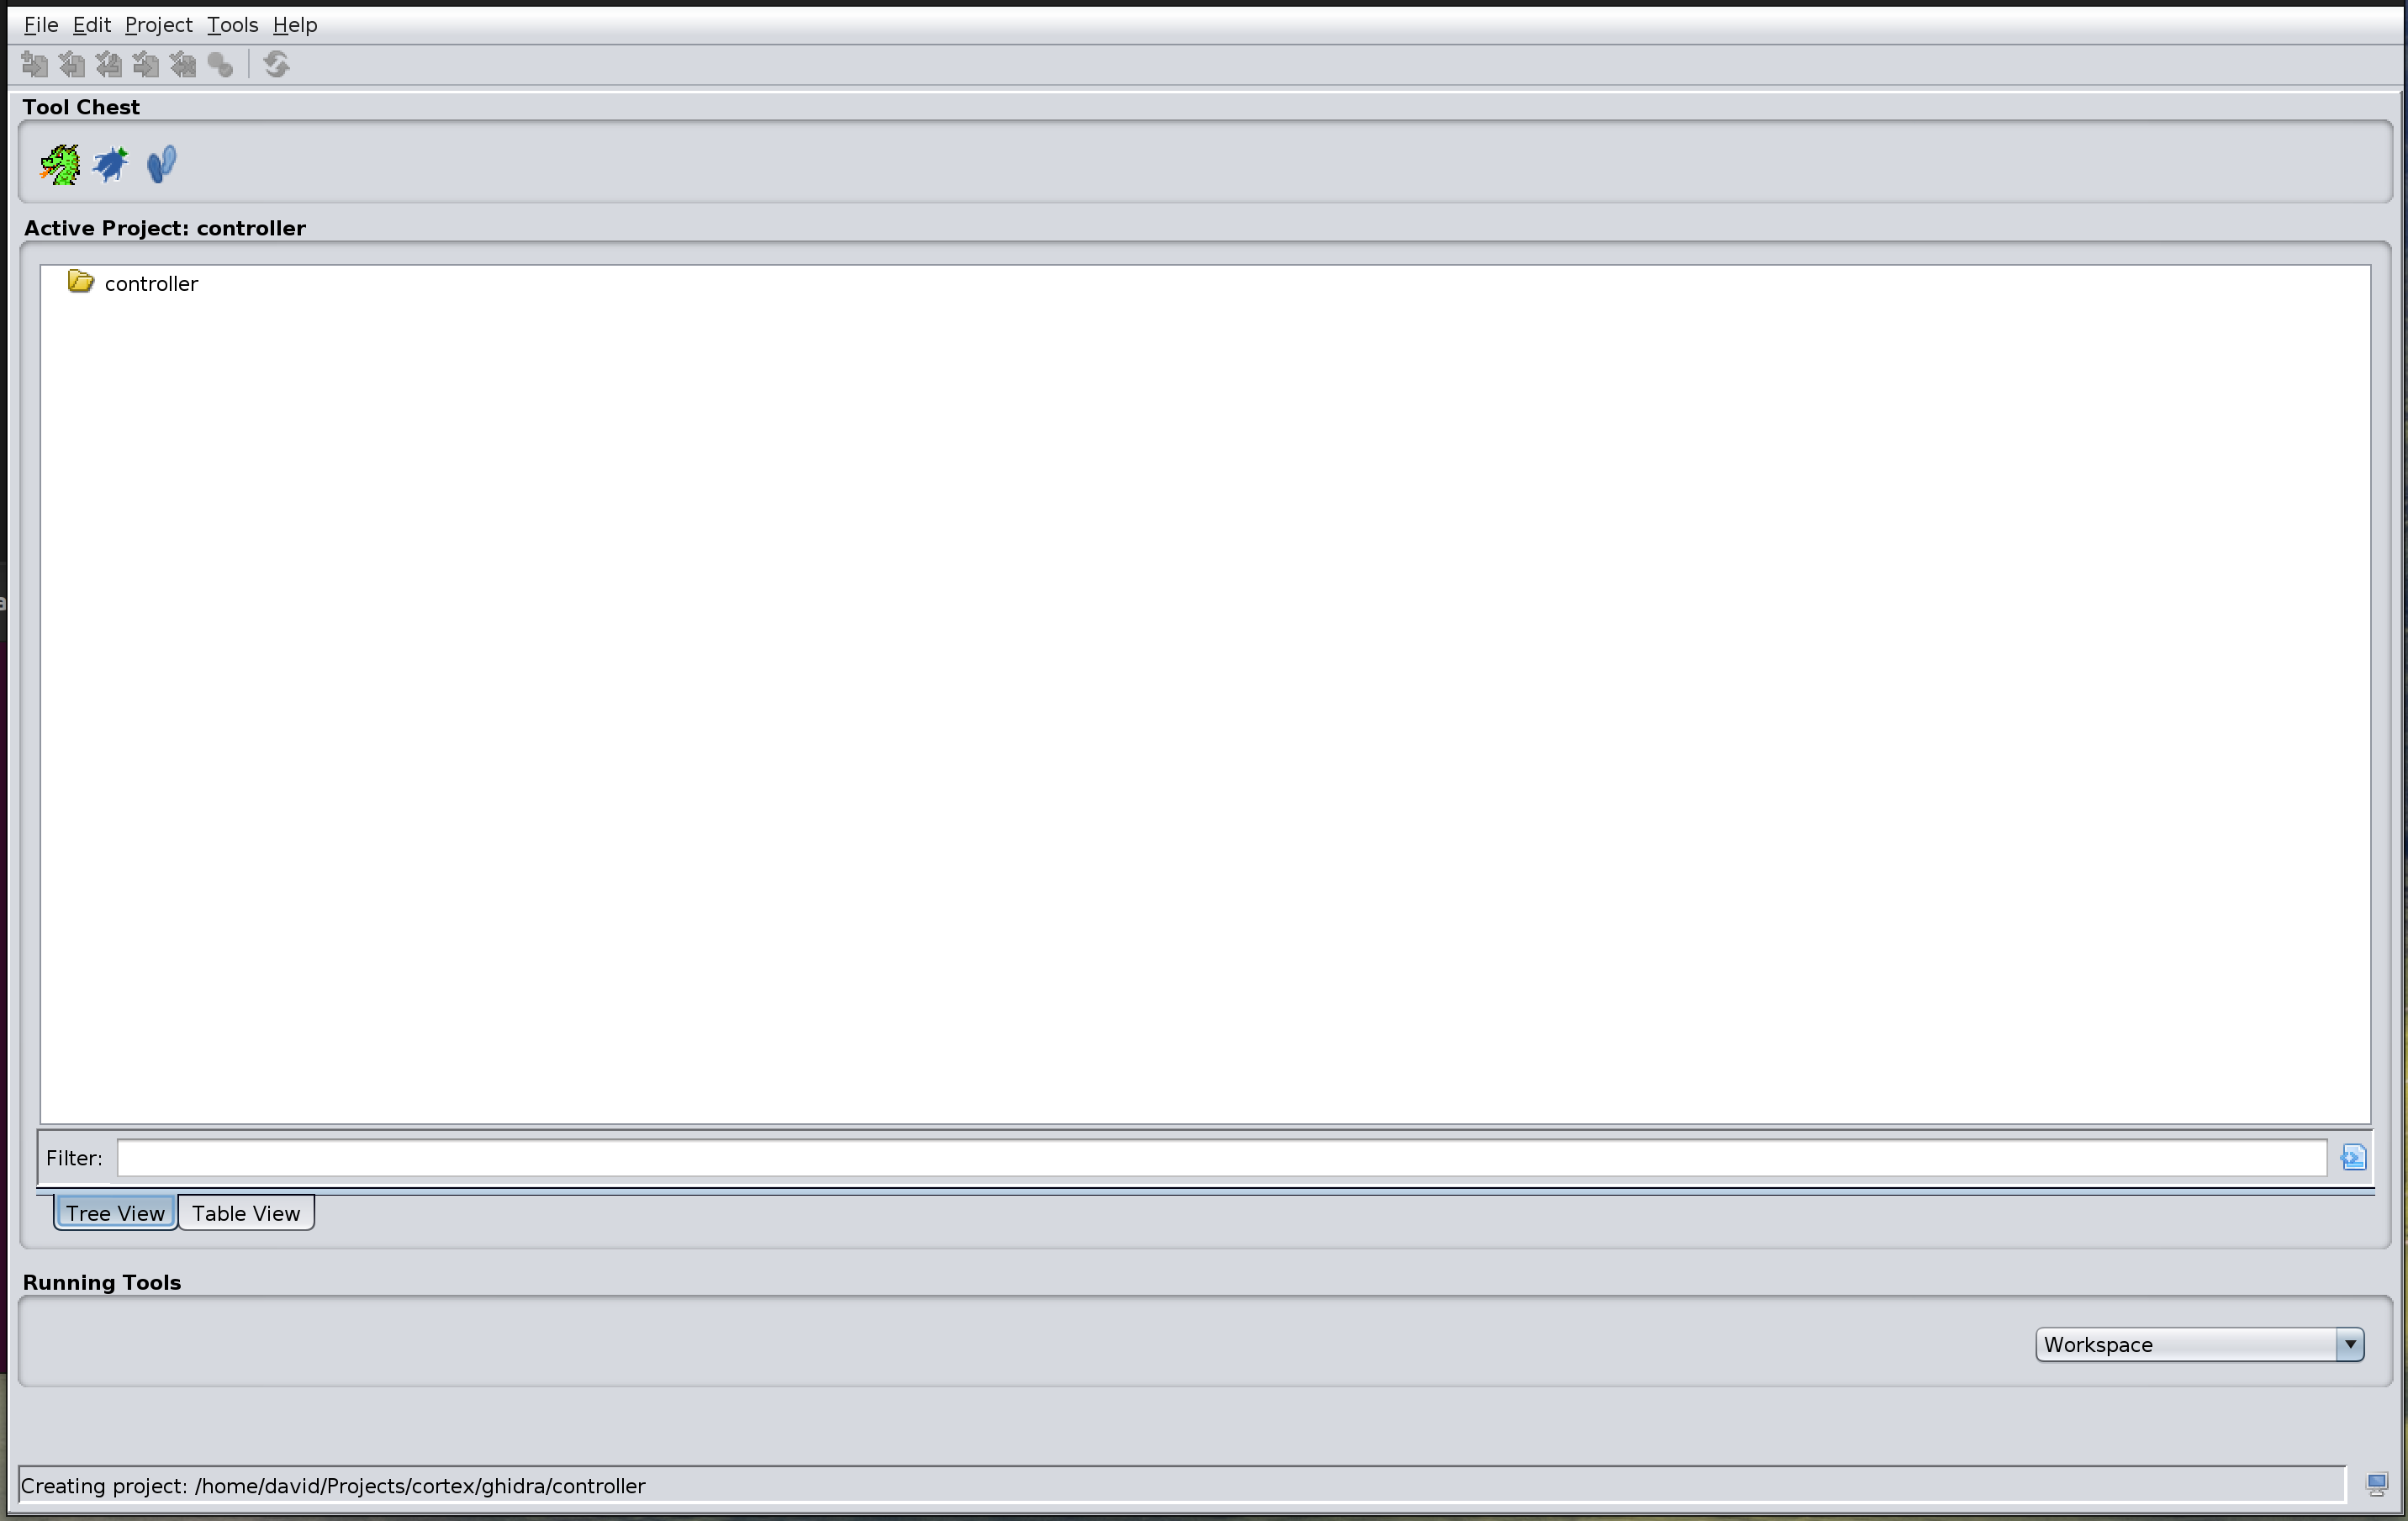
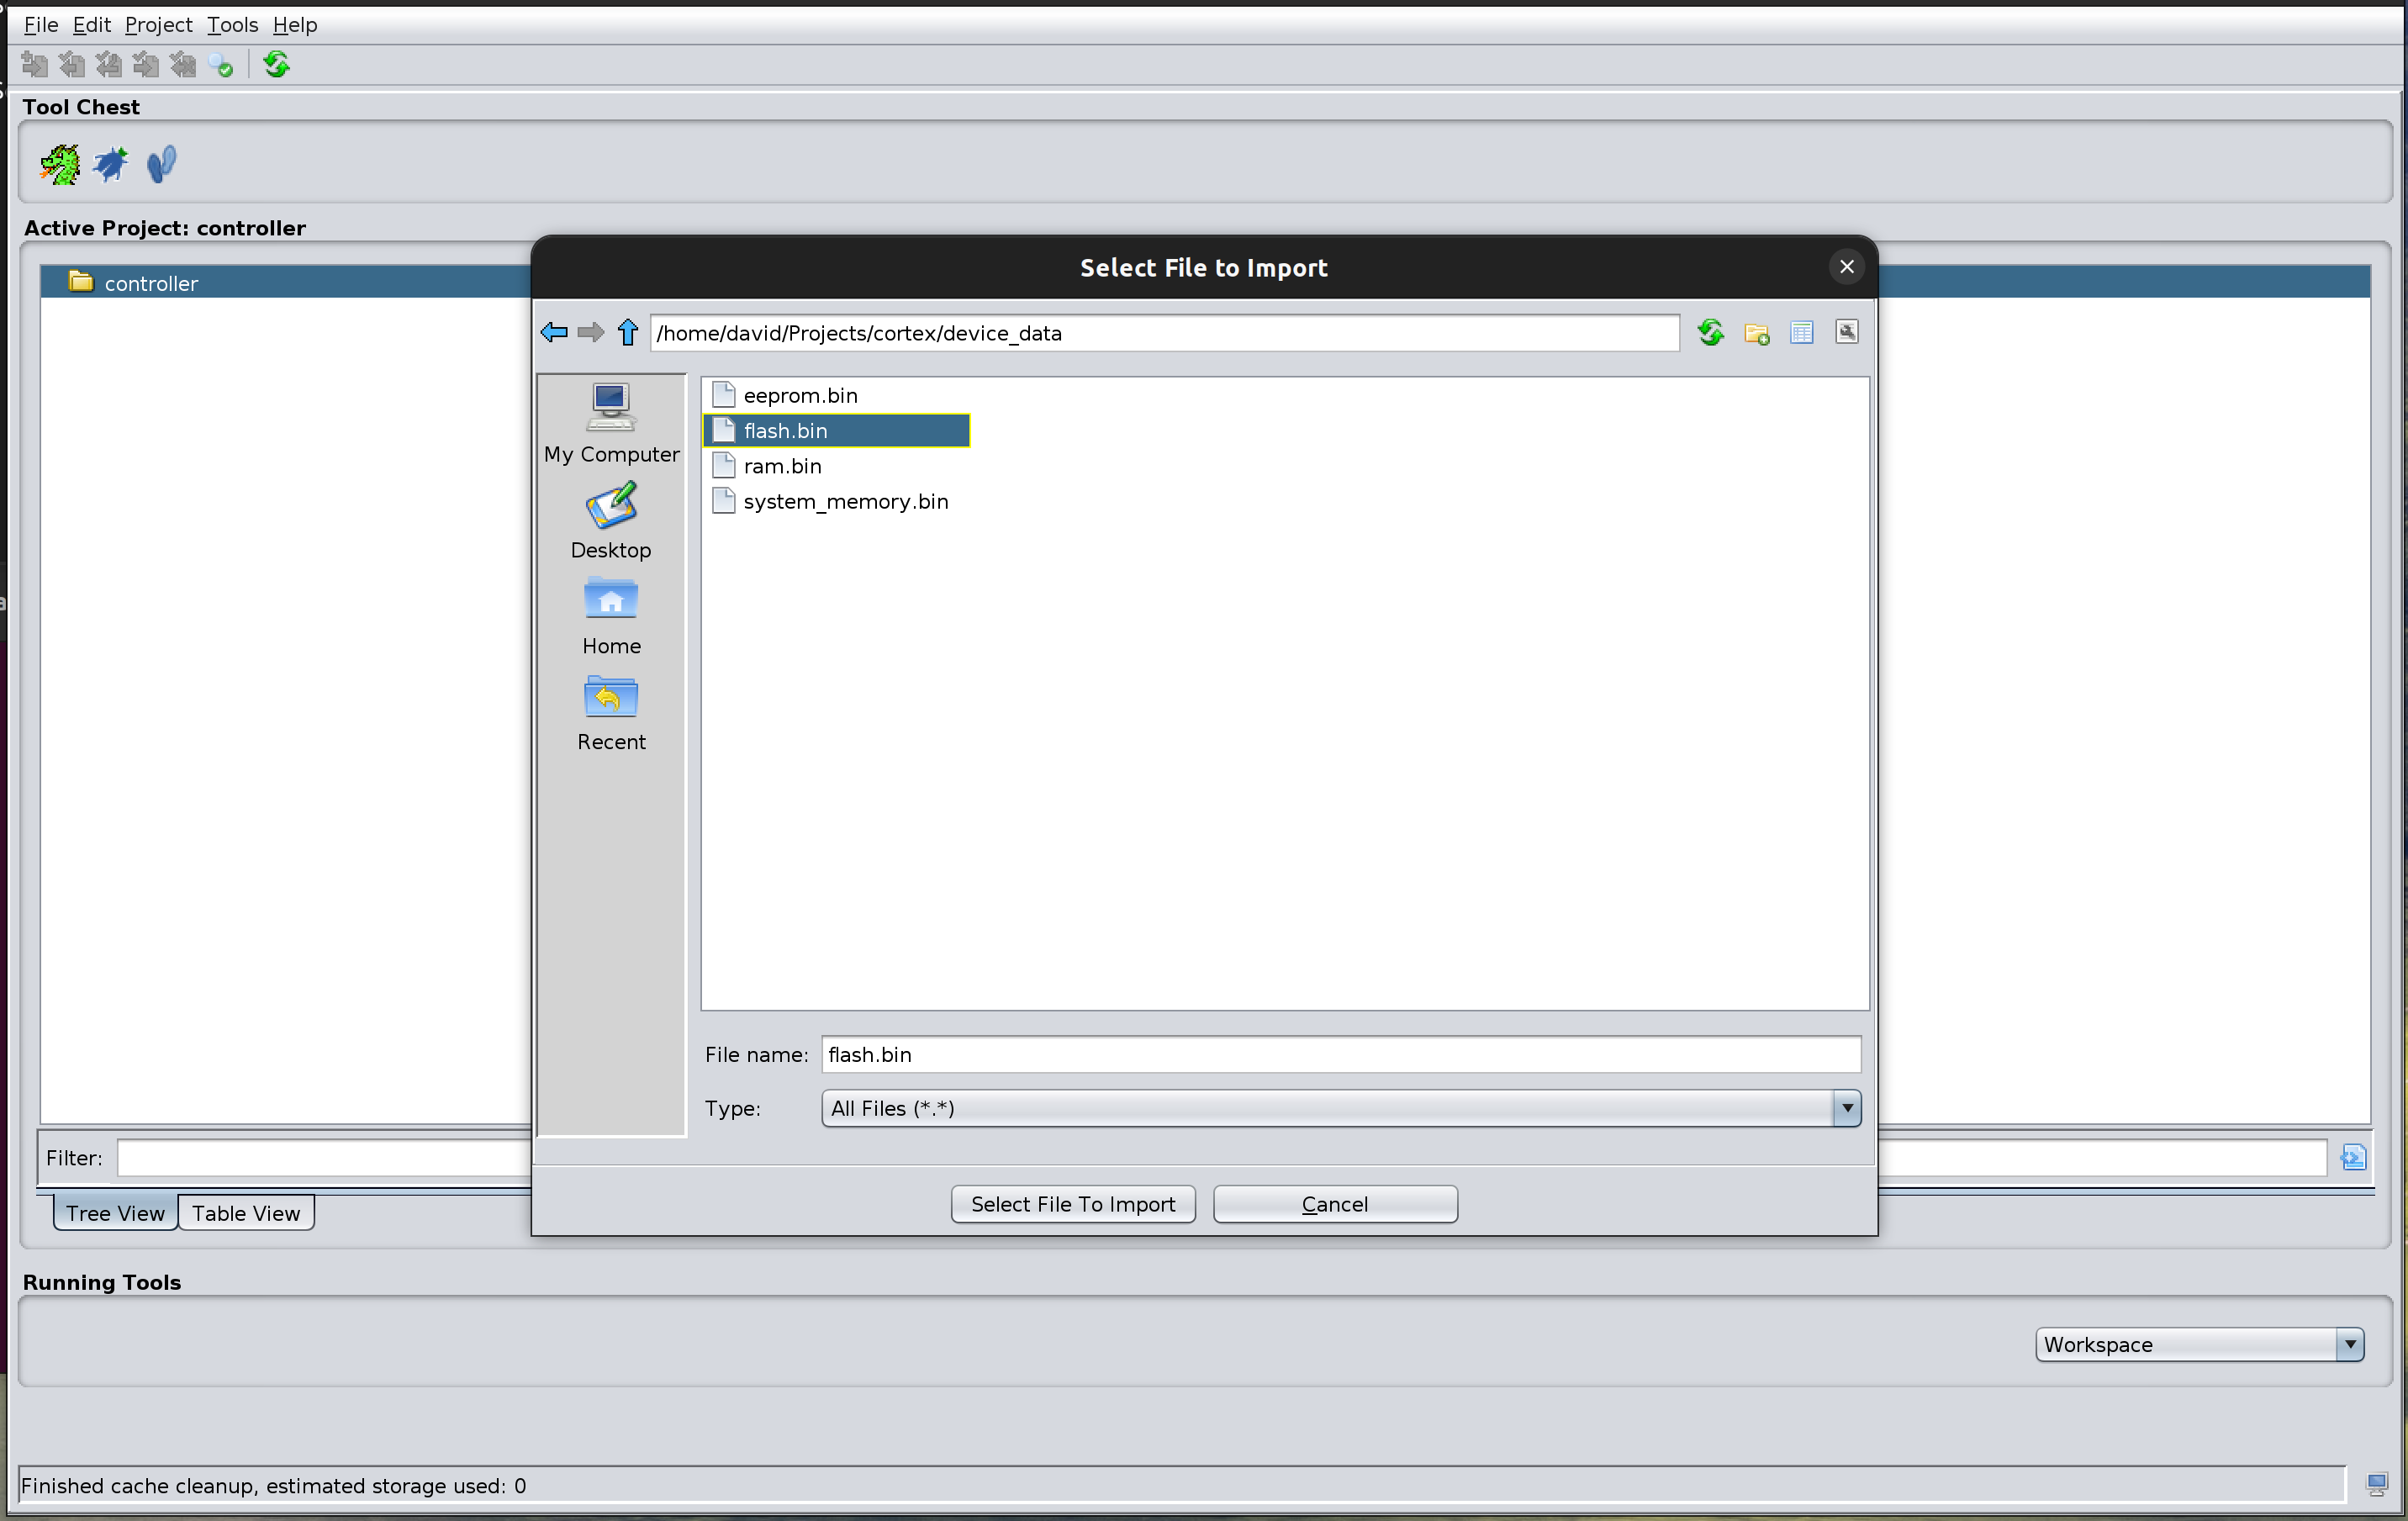
Within the project I next opened what would be my "main" file, in this case flash.bin.
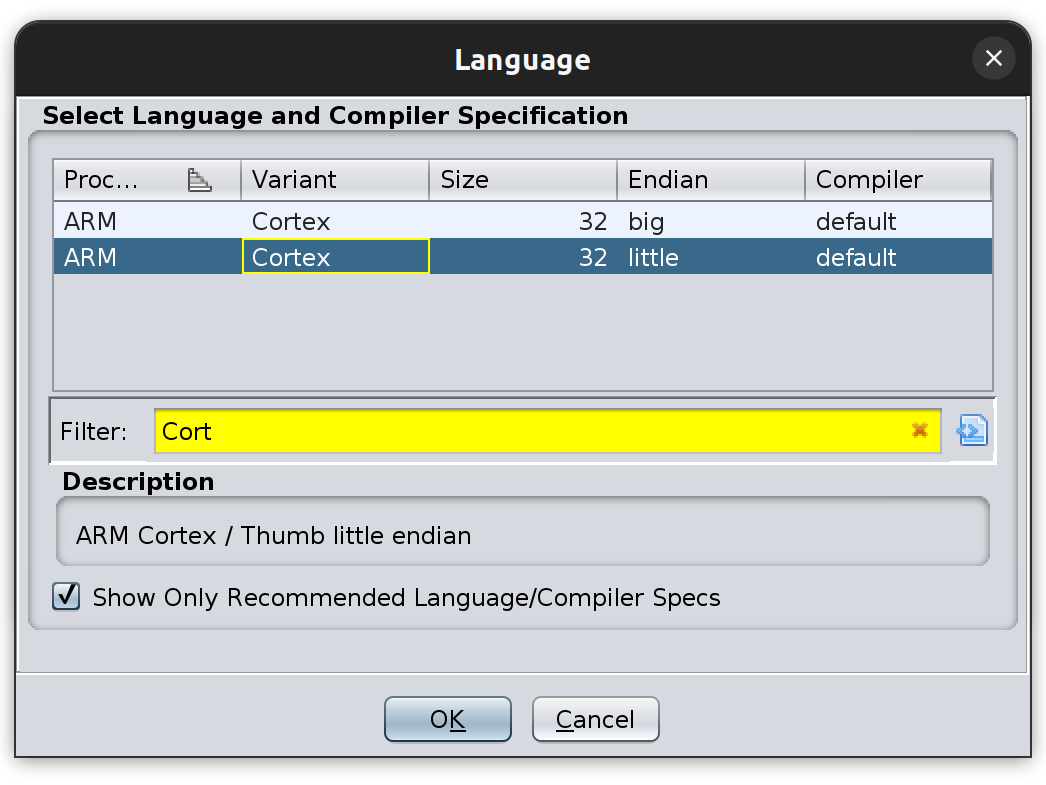
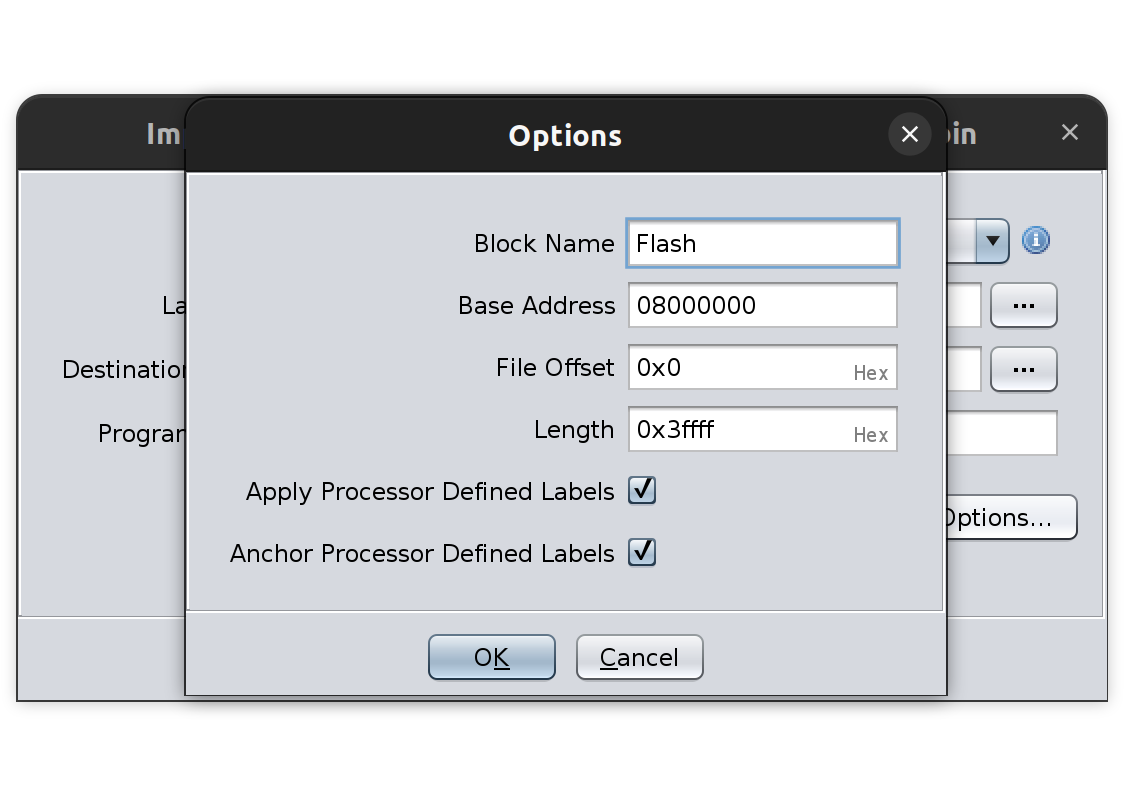
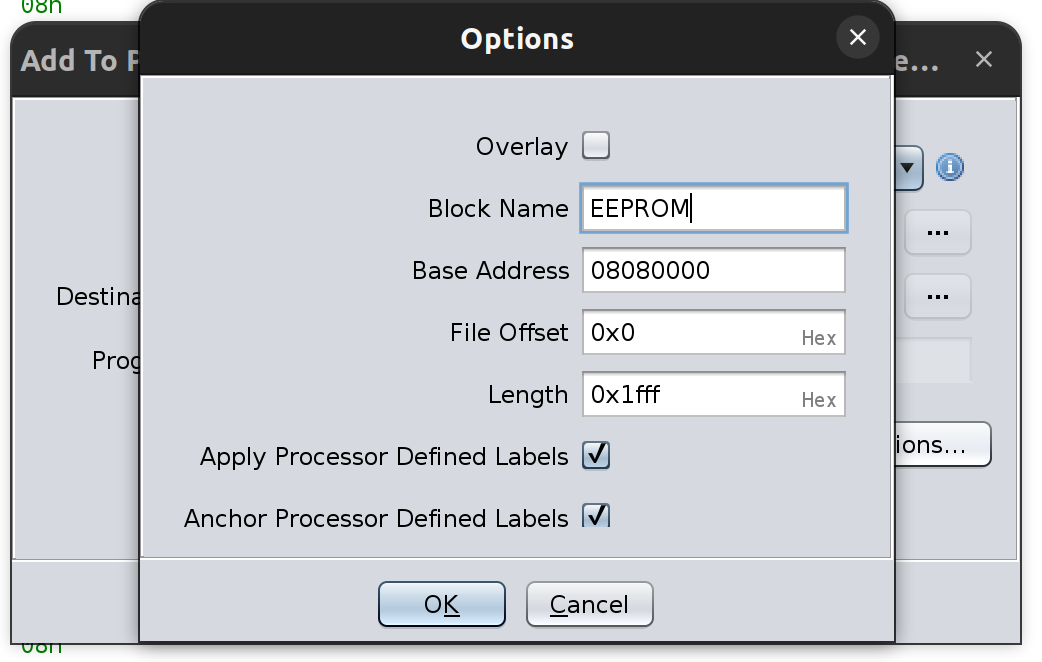
There are a few options you need to set for the file prior to import. The most important one is to select the language.
You also need to select what to import and how it should be created within the memory map.
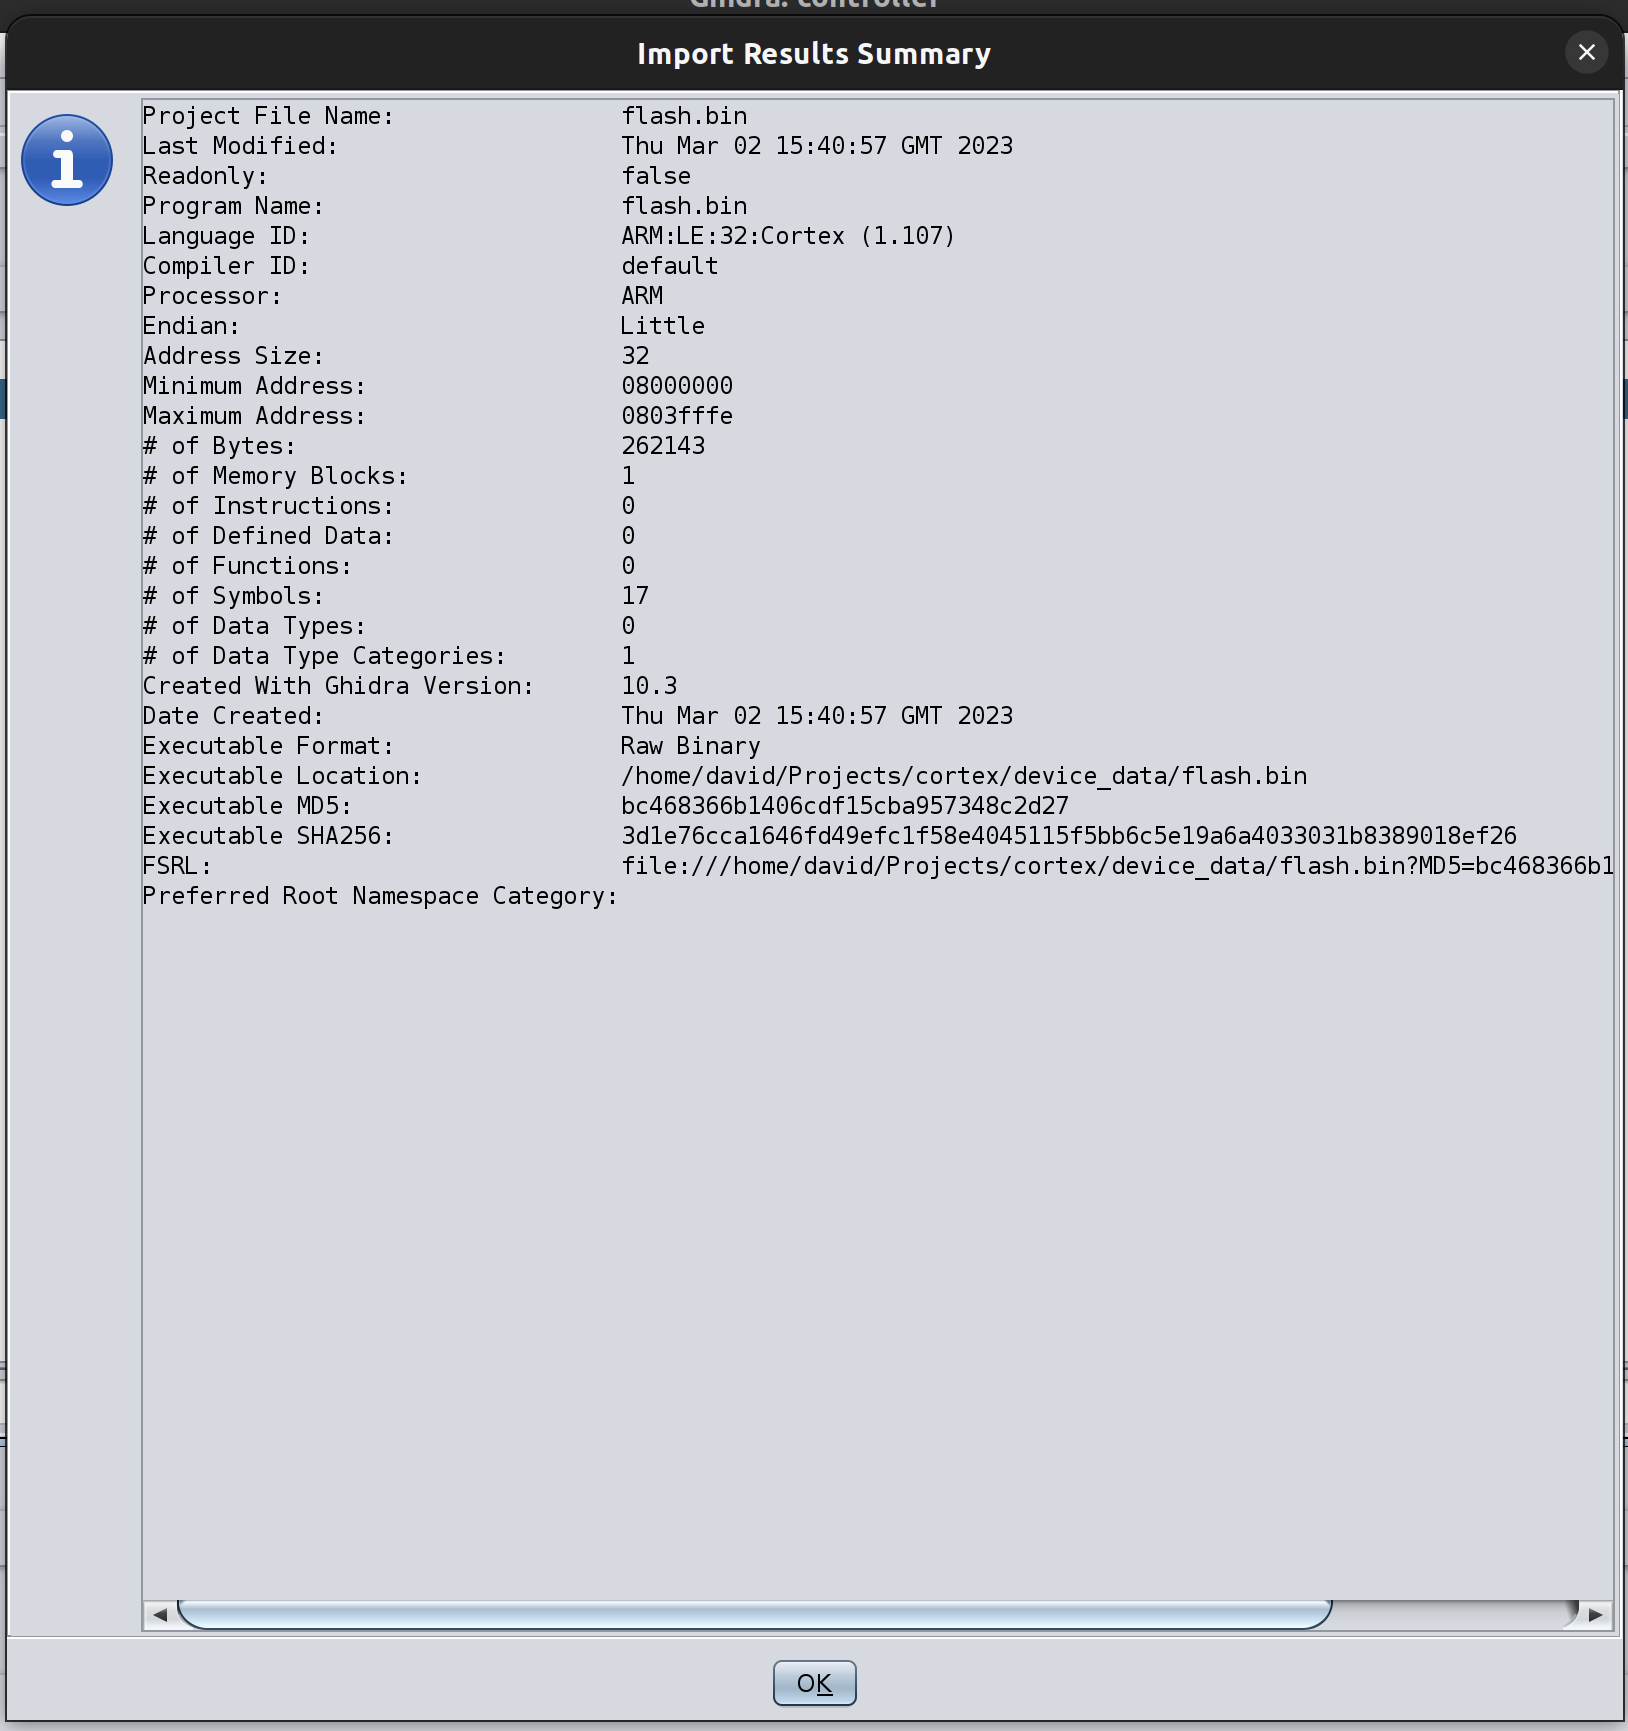
Once the options have been set it can be imported. Ghidra always displays a summary of each import.
The file now shows as part of the project. In order to do more you need to open the file in a CodeBrowser window by double clicking it.
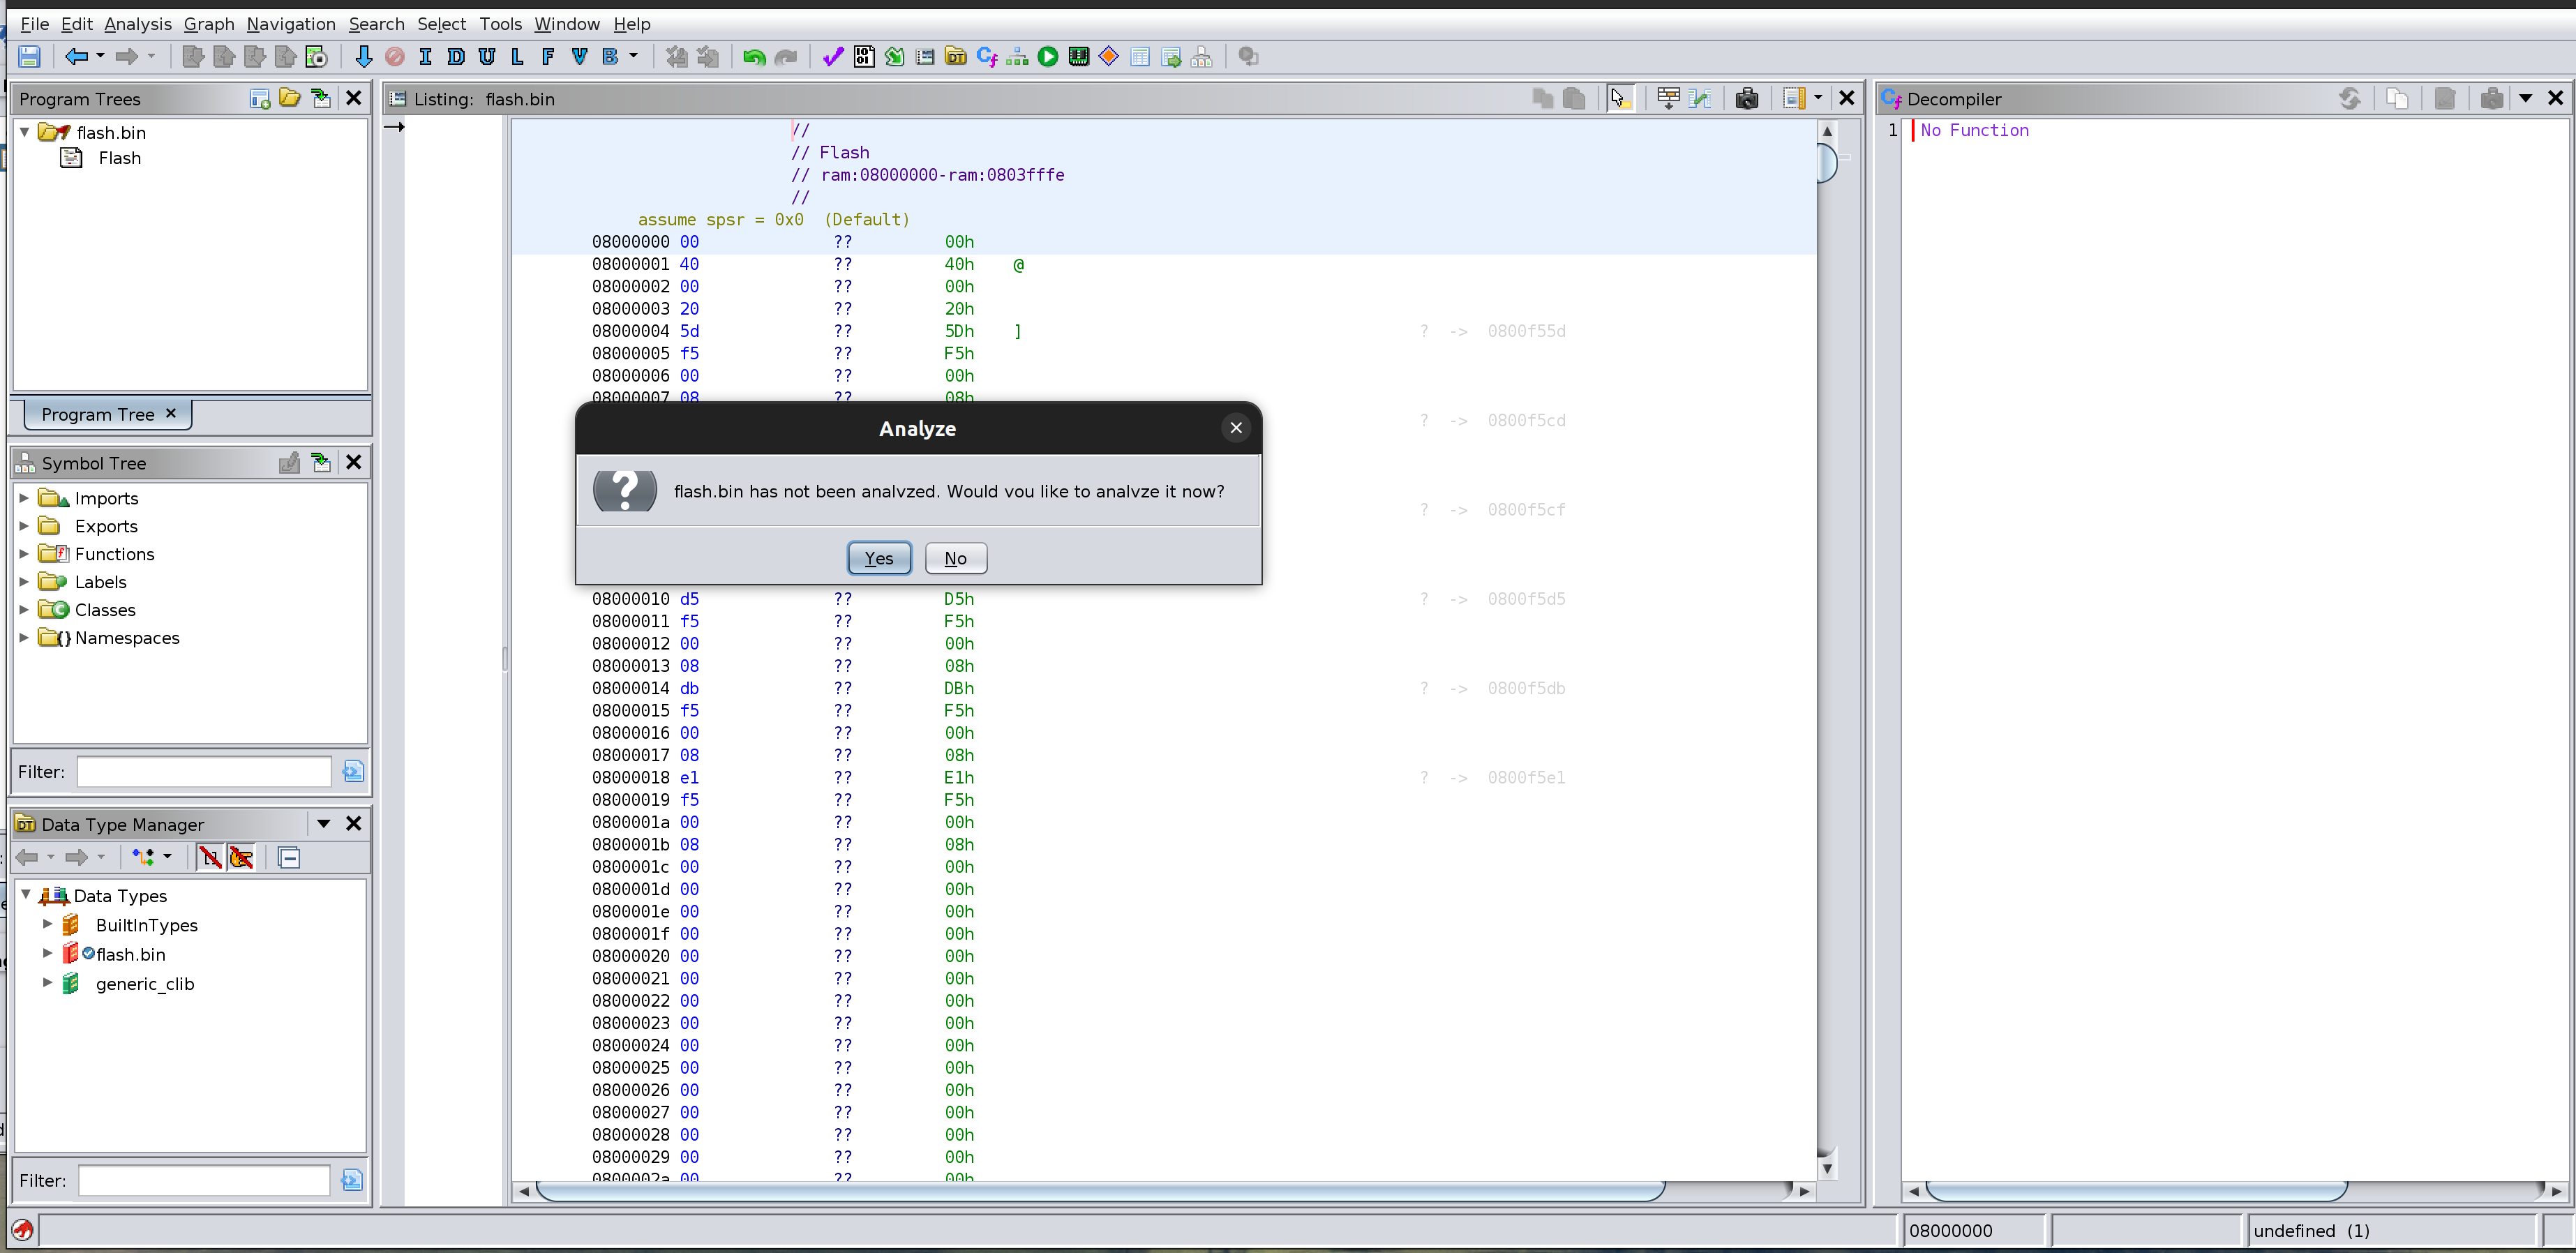
After it opened I initially chose not to run an analysis.
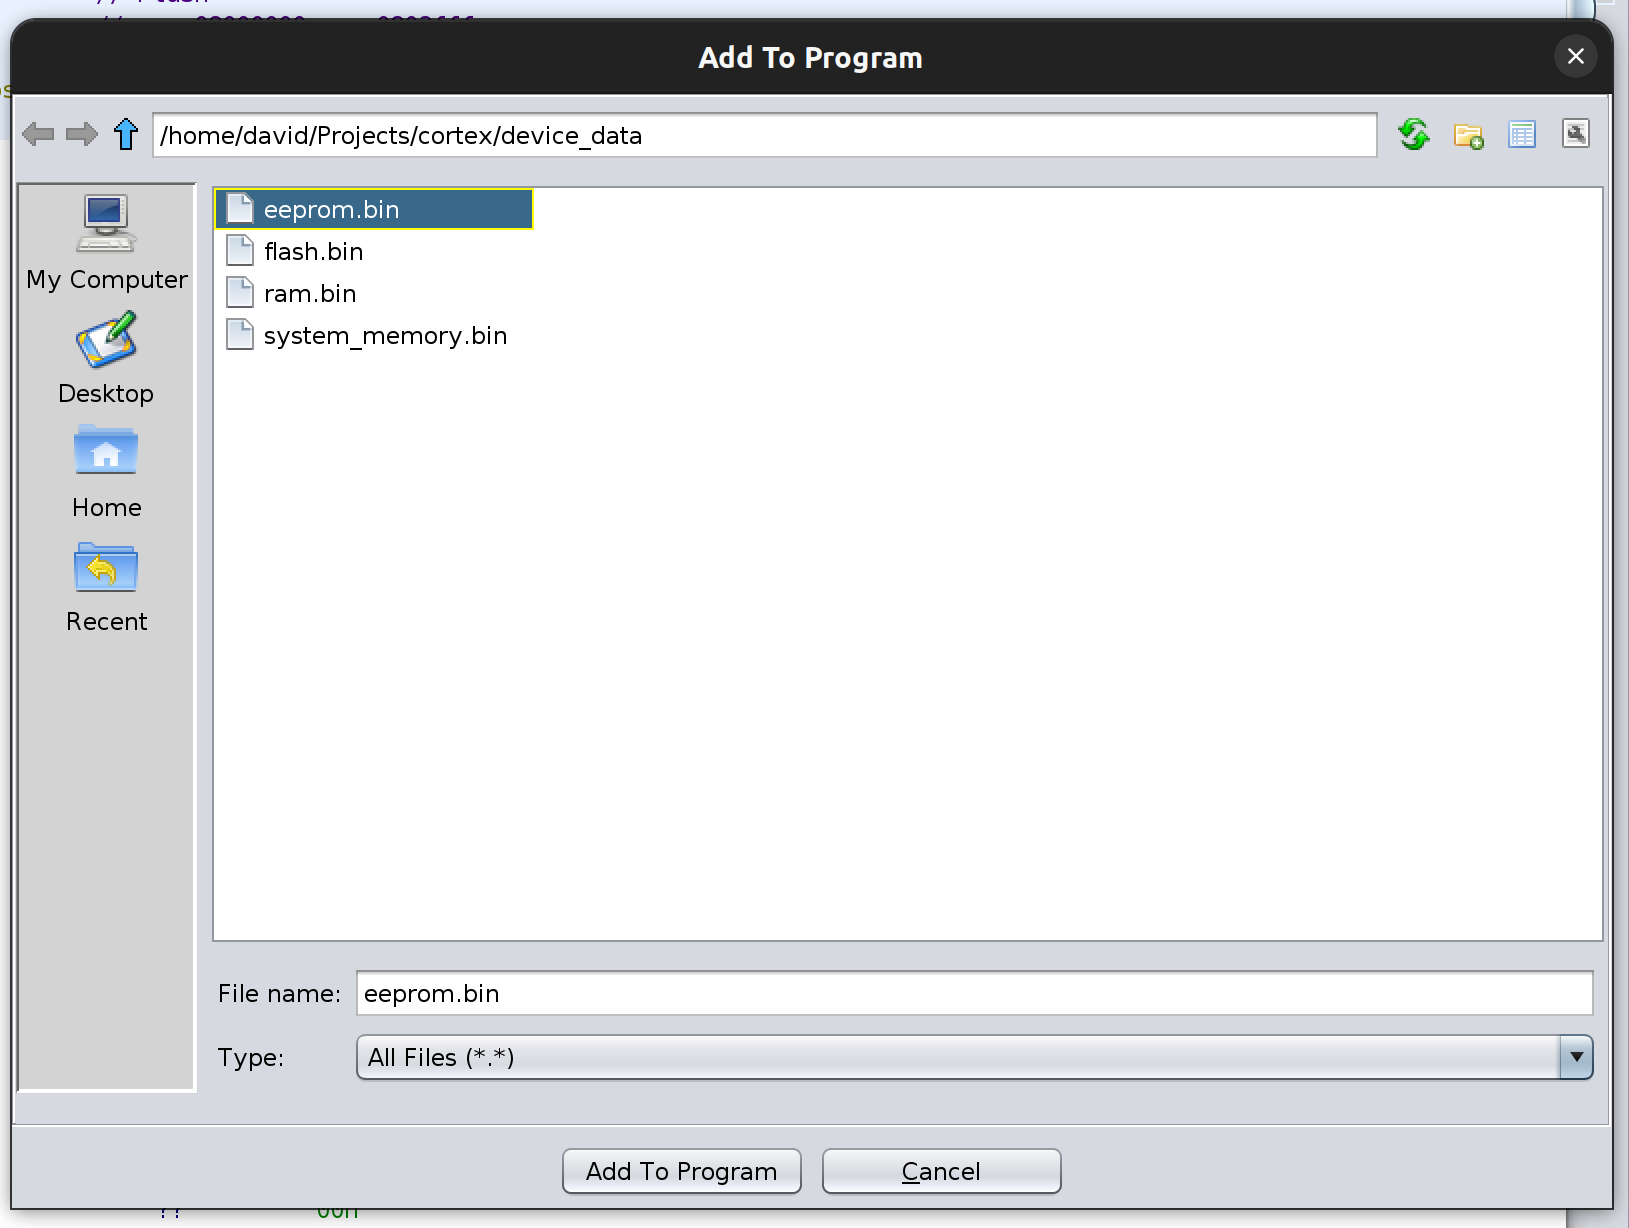
Next I wanted to add the other binary files I had prepared. This took me a while to figure out. I found a blog post came to the rescue with the mention of the File > Add to Program... option. This did exactly what I wanted.
Each file you add needs to have the memory map options set, just as for the initially imported file.
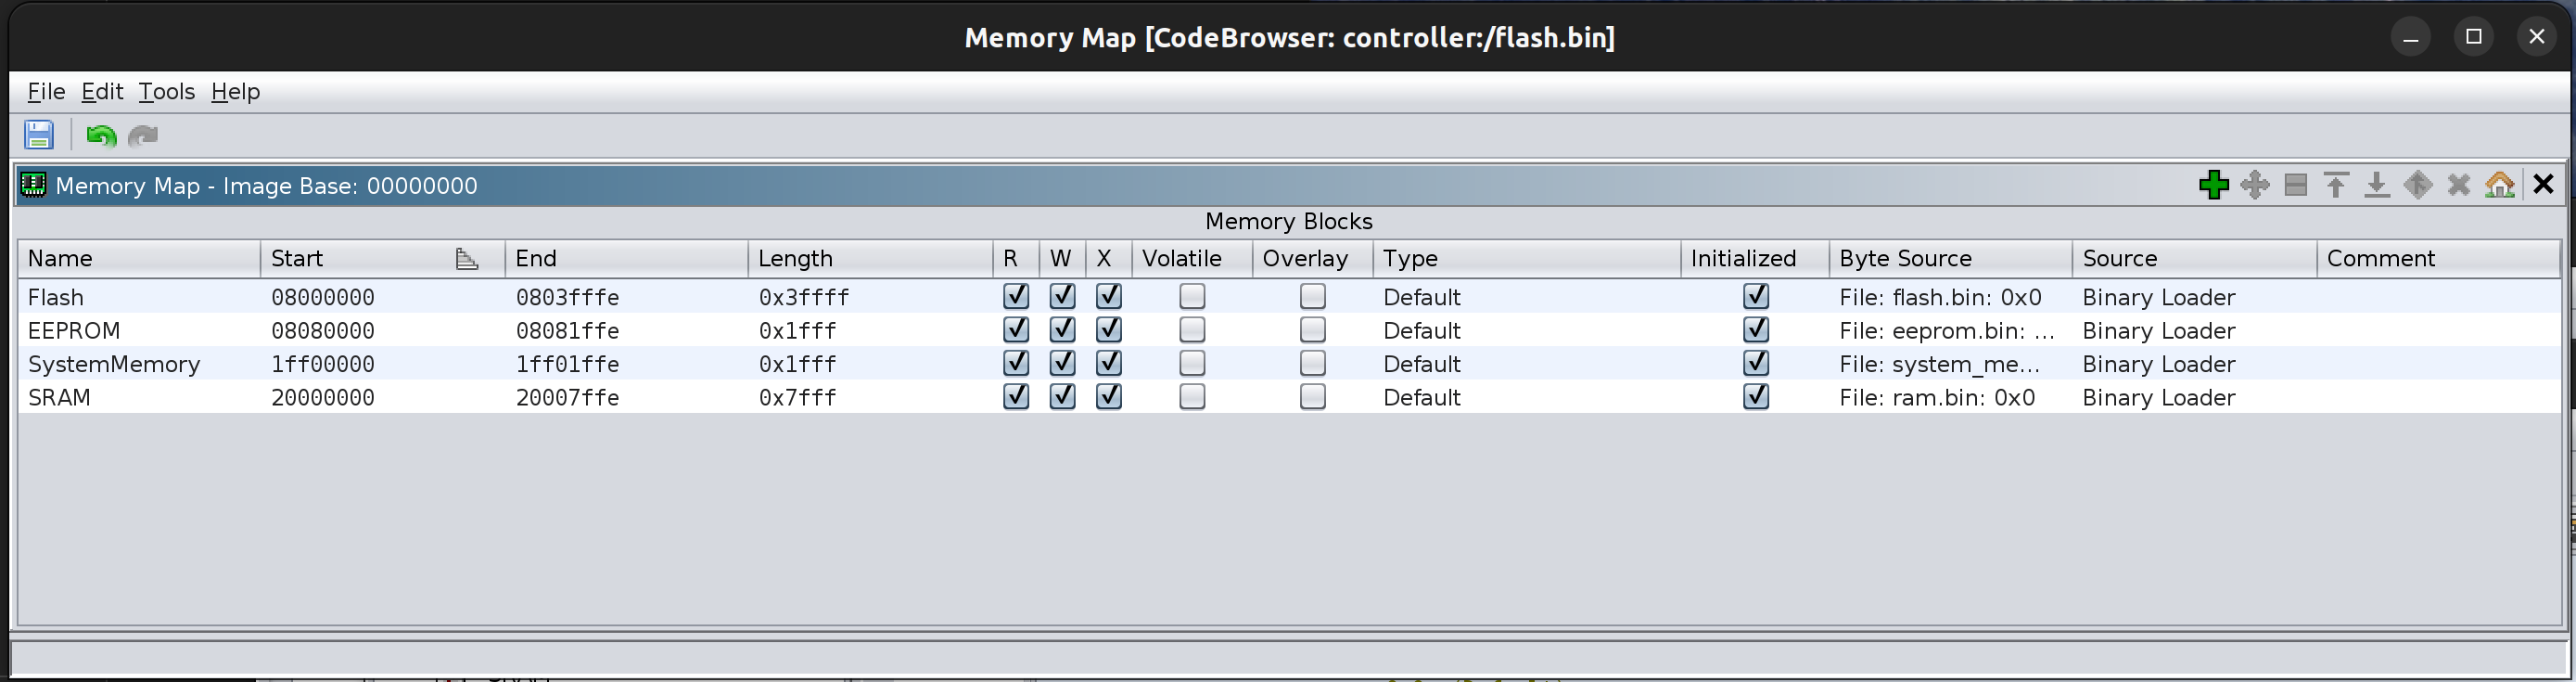
After repeating this for the other binary files I dumped the memory map was starting to look better.
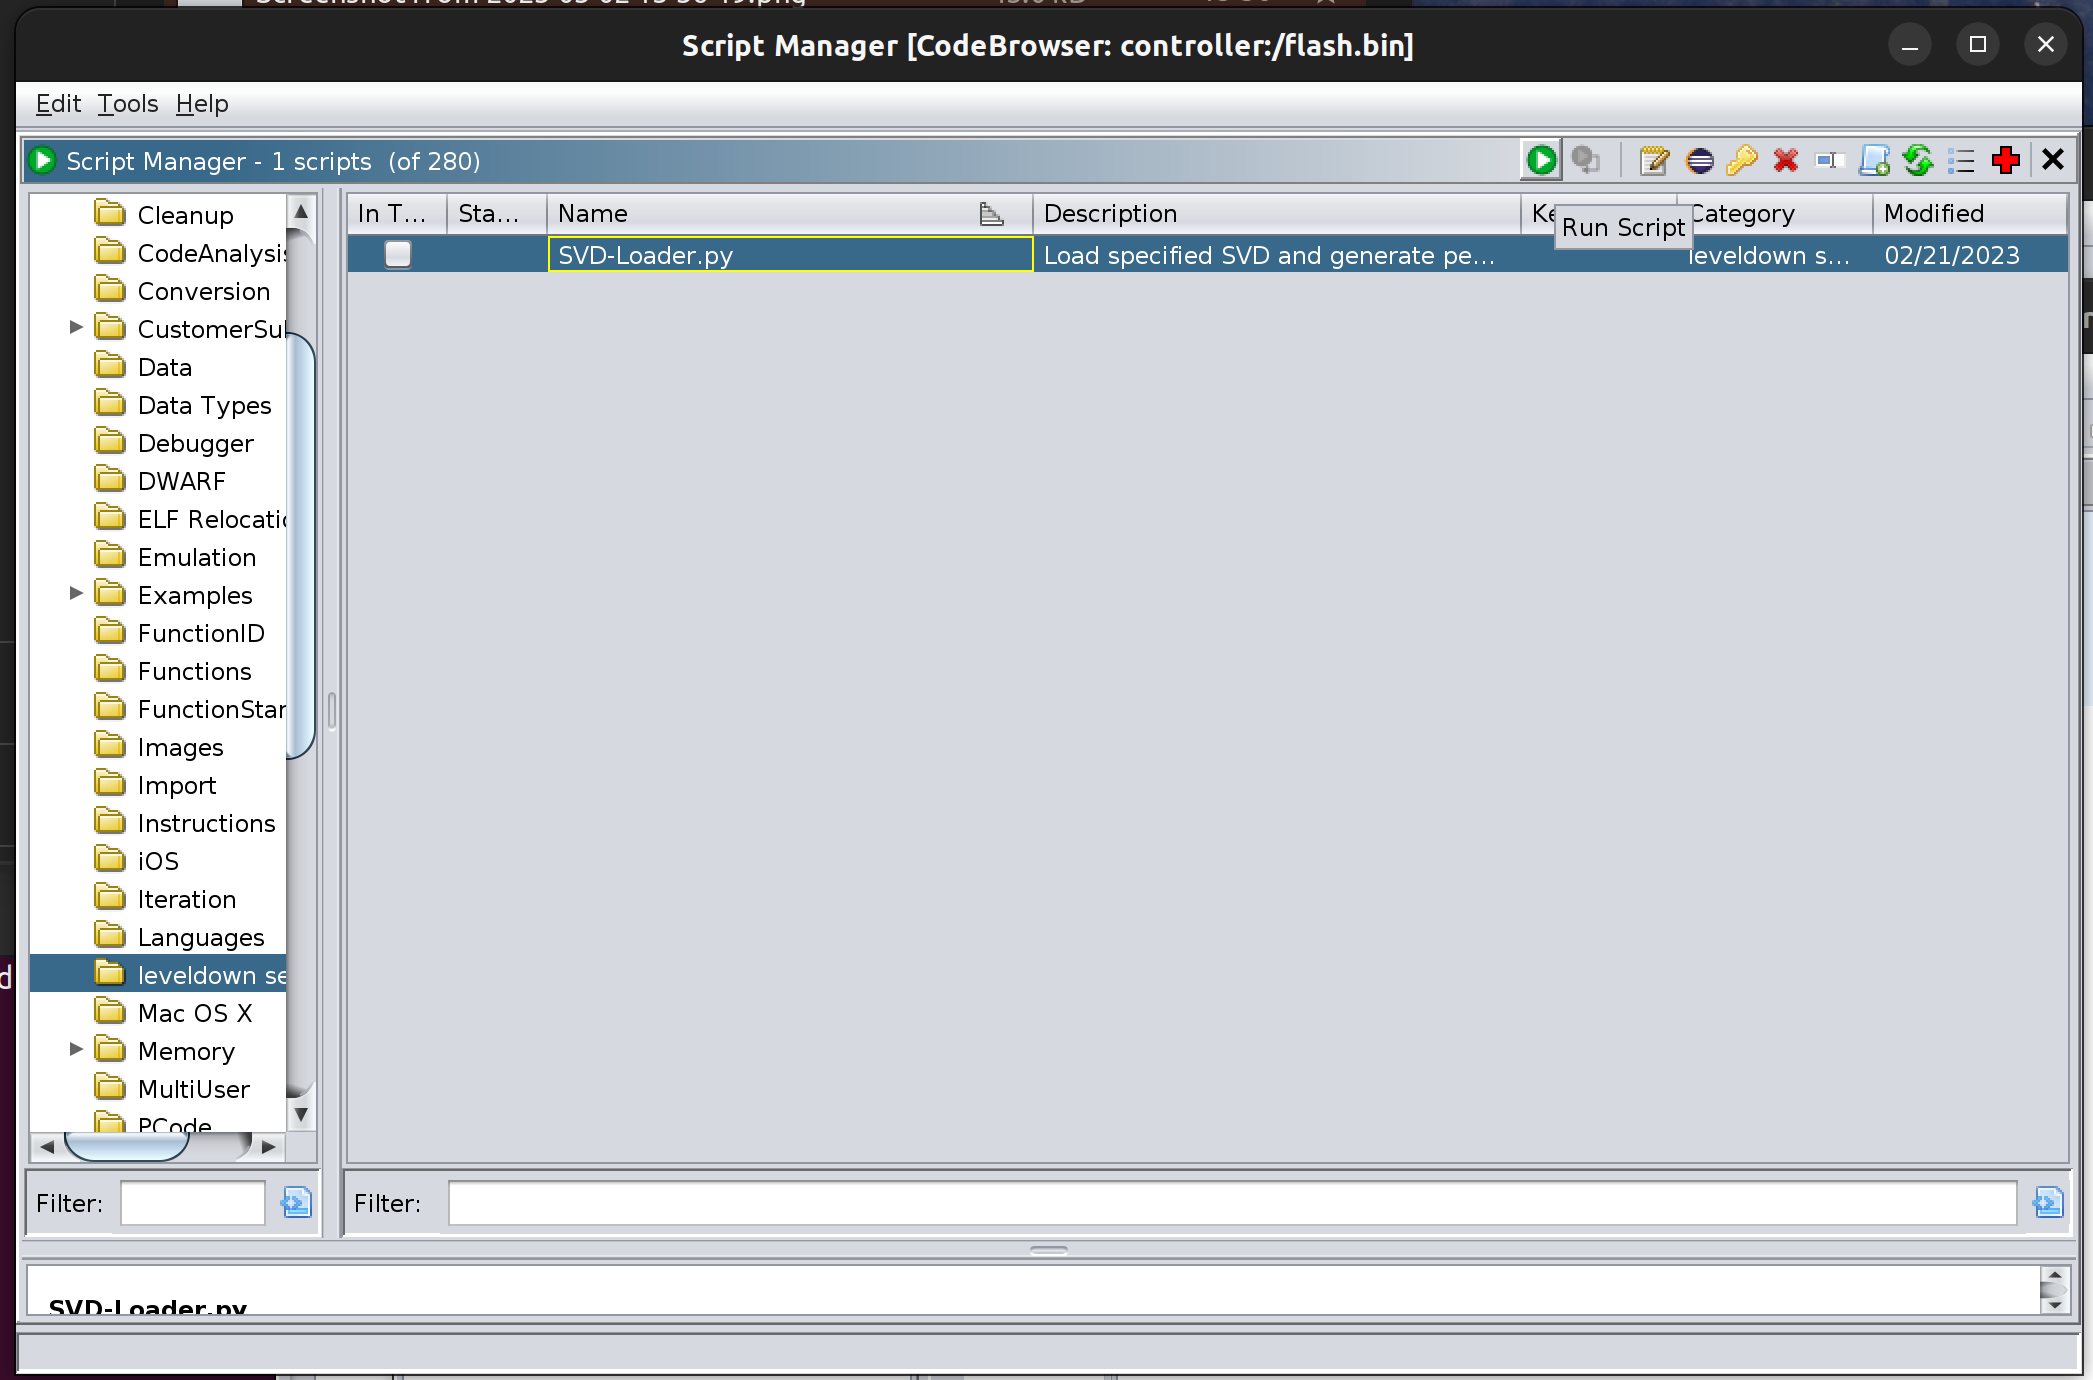
I next wanted to add some details of the registers and peripherals that were available for the processor. Rather than adding them all manually, I installed the very useful SVD-Loader script. The simplest way I found to run it is via the Script Manager.
The SVD file I imported was this one.
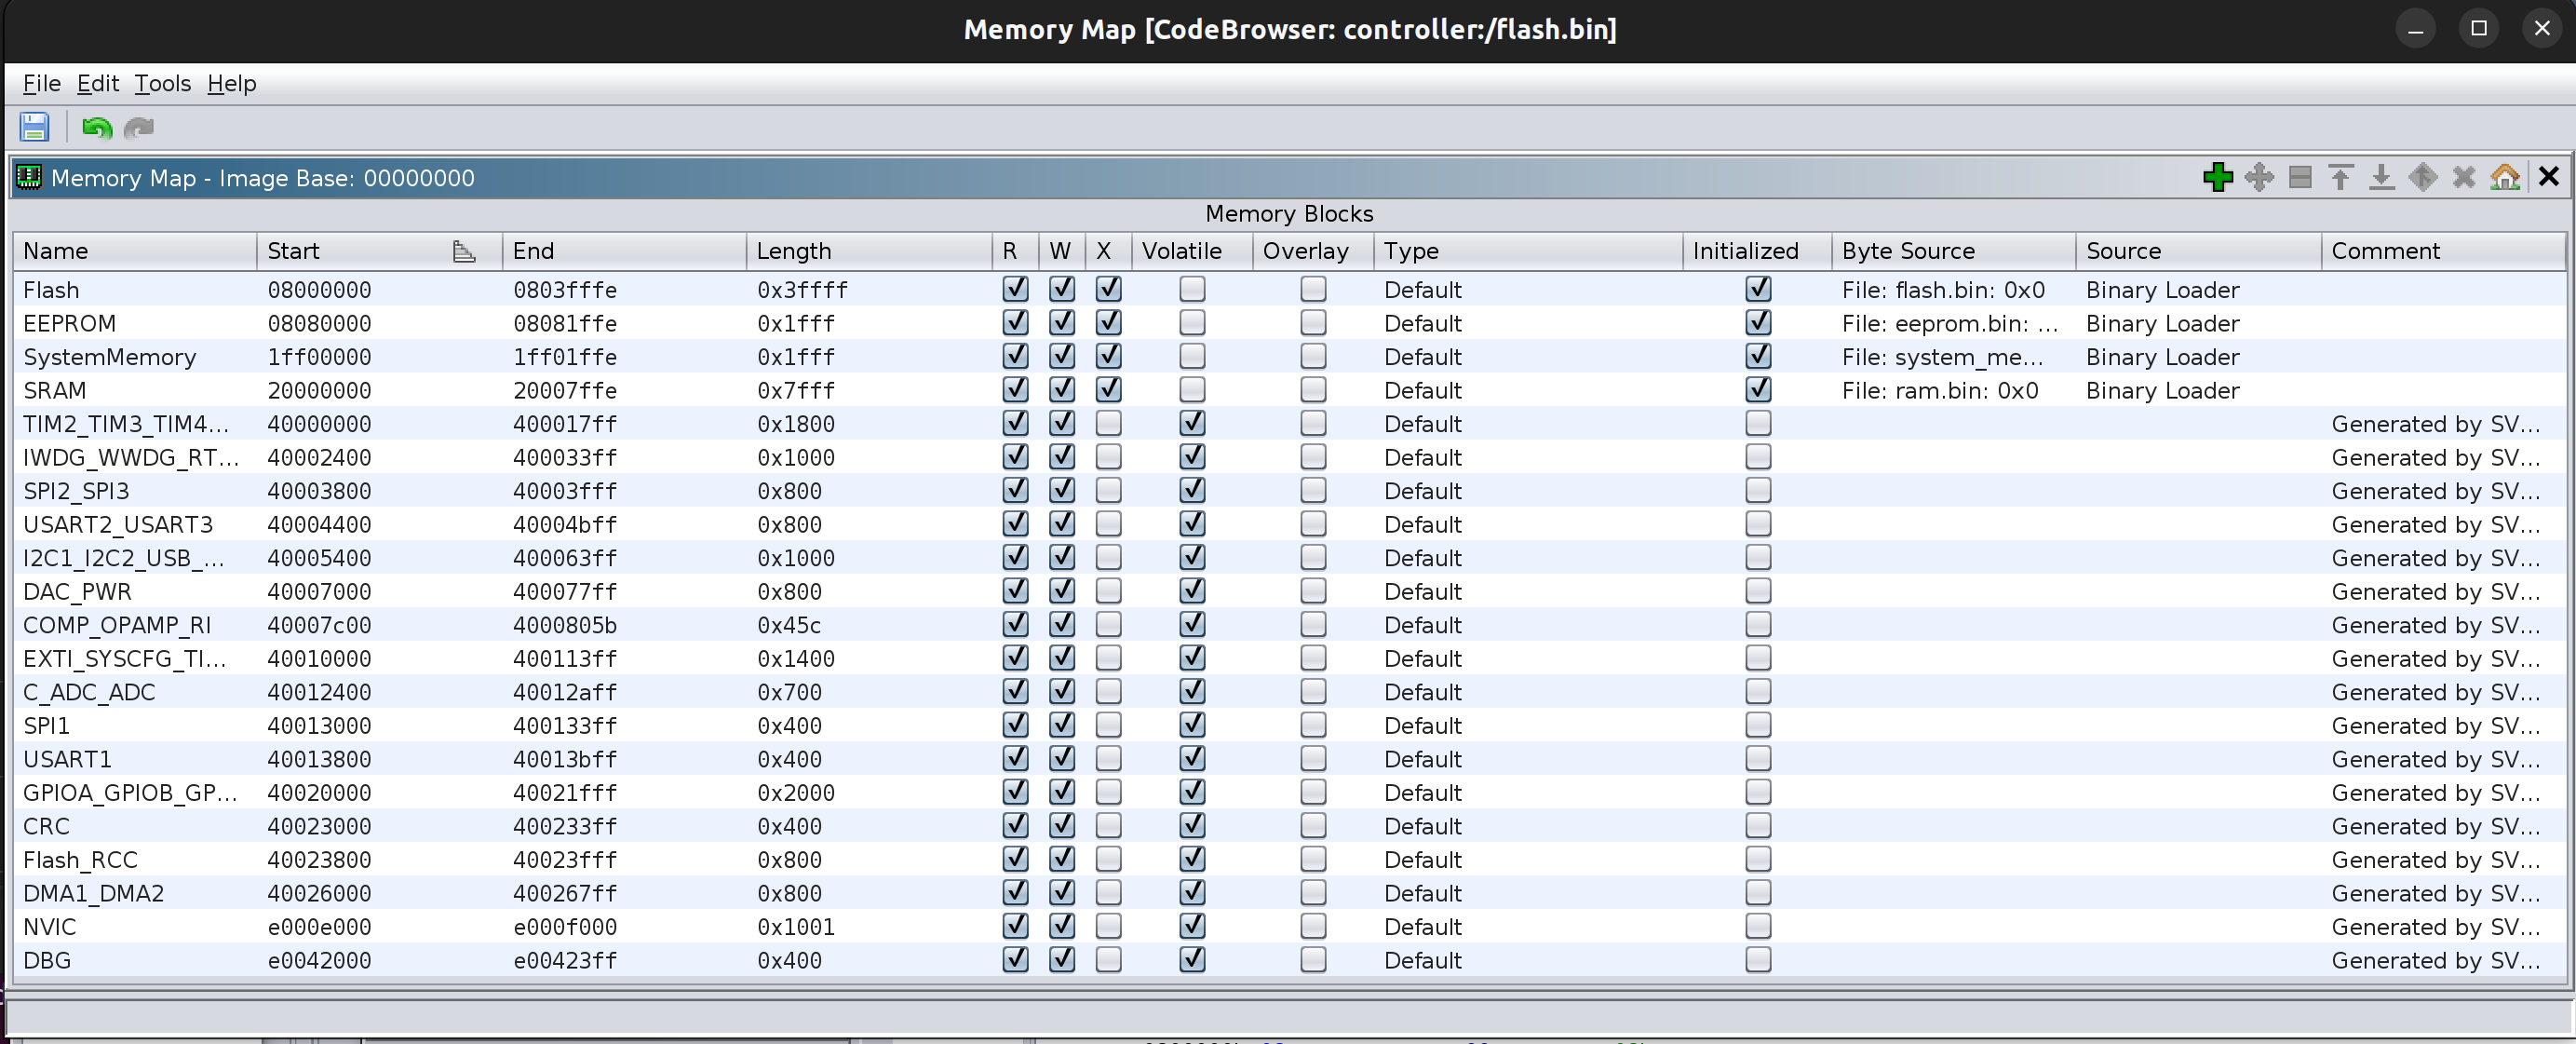
Once complete, the memory map was much fuller.
The final step prior to analysing the data was to add a mirrored copy of the initial file at address 0x0. This is done when the device starts and allows for the initial vector table to be used from address 0x0.
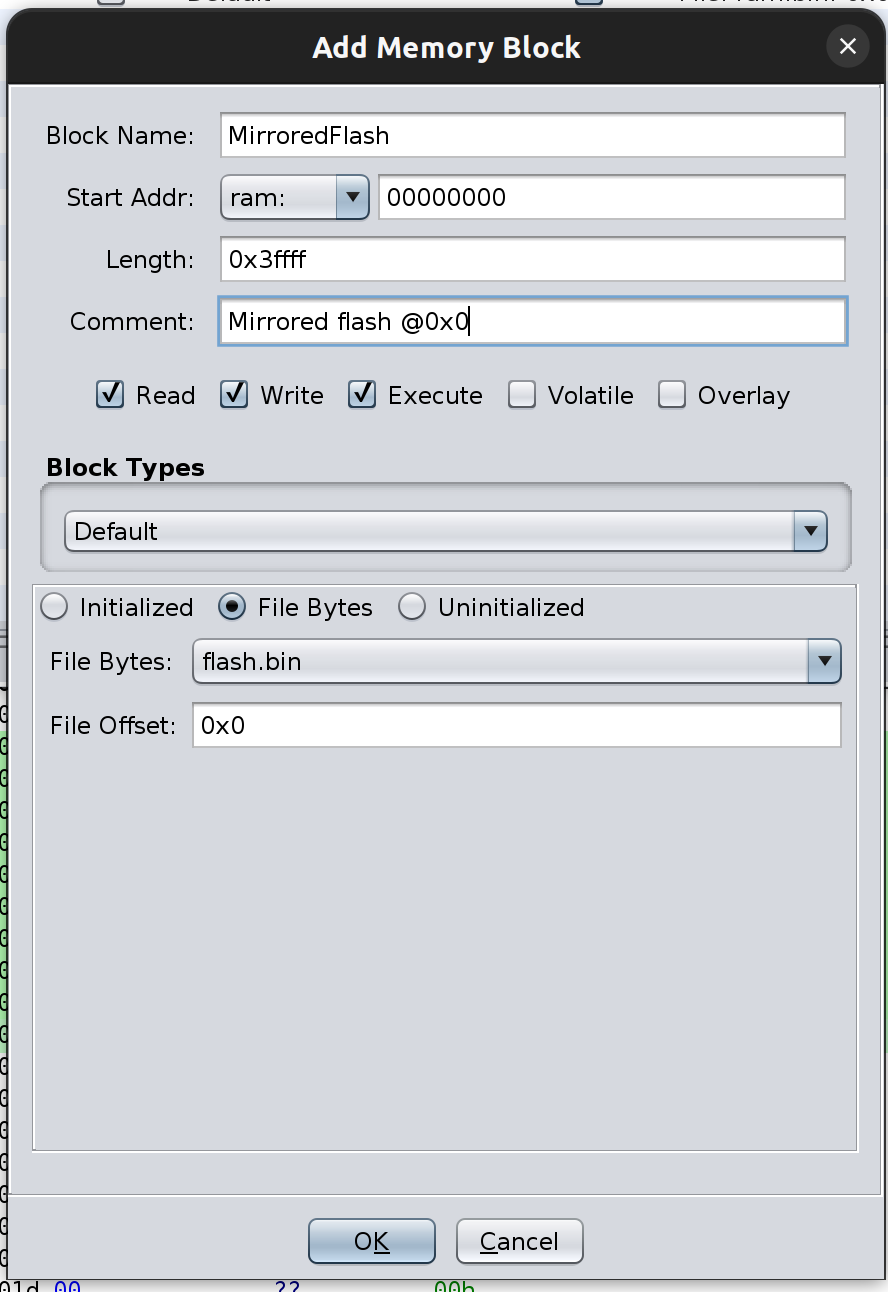
With the memory mapping complete, it was time to analyse!
Analysing...
To run the analysis, I chose the Analysis > Analyse All Open option. After selecting suitable options the analysis started. It only took a short while for the results to appear.
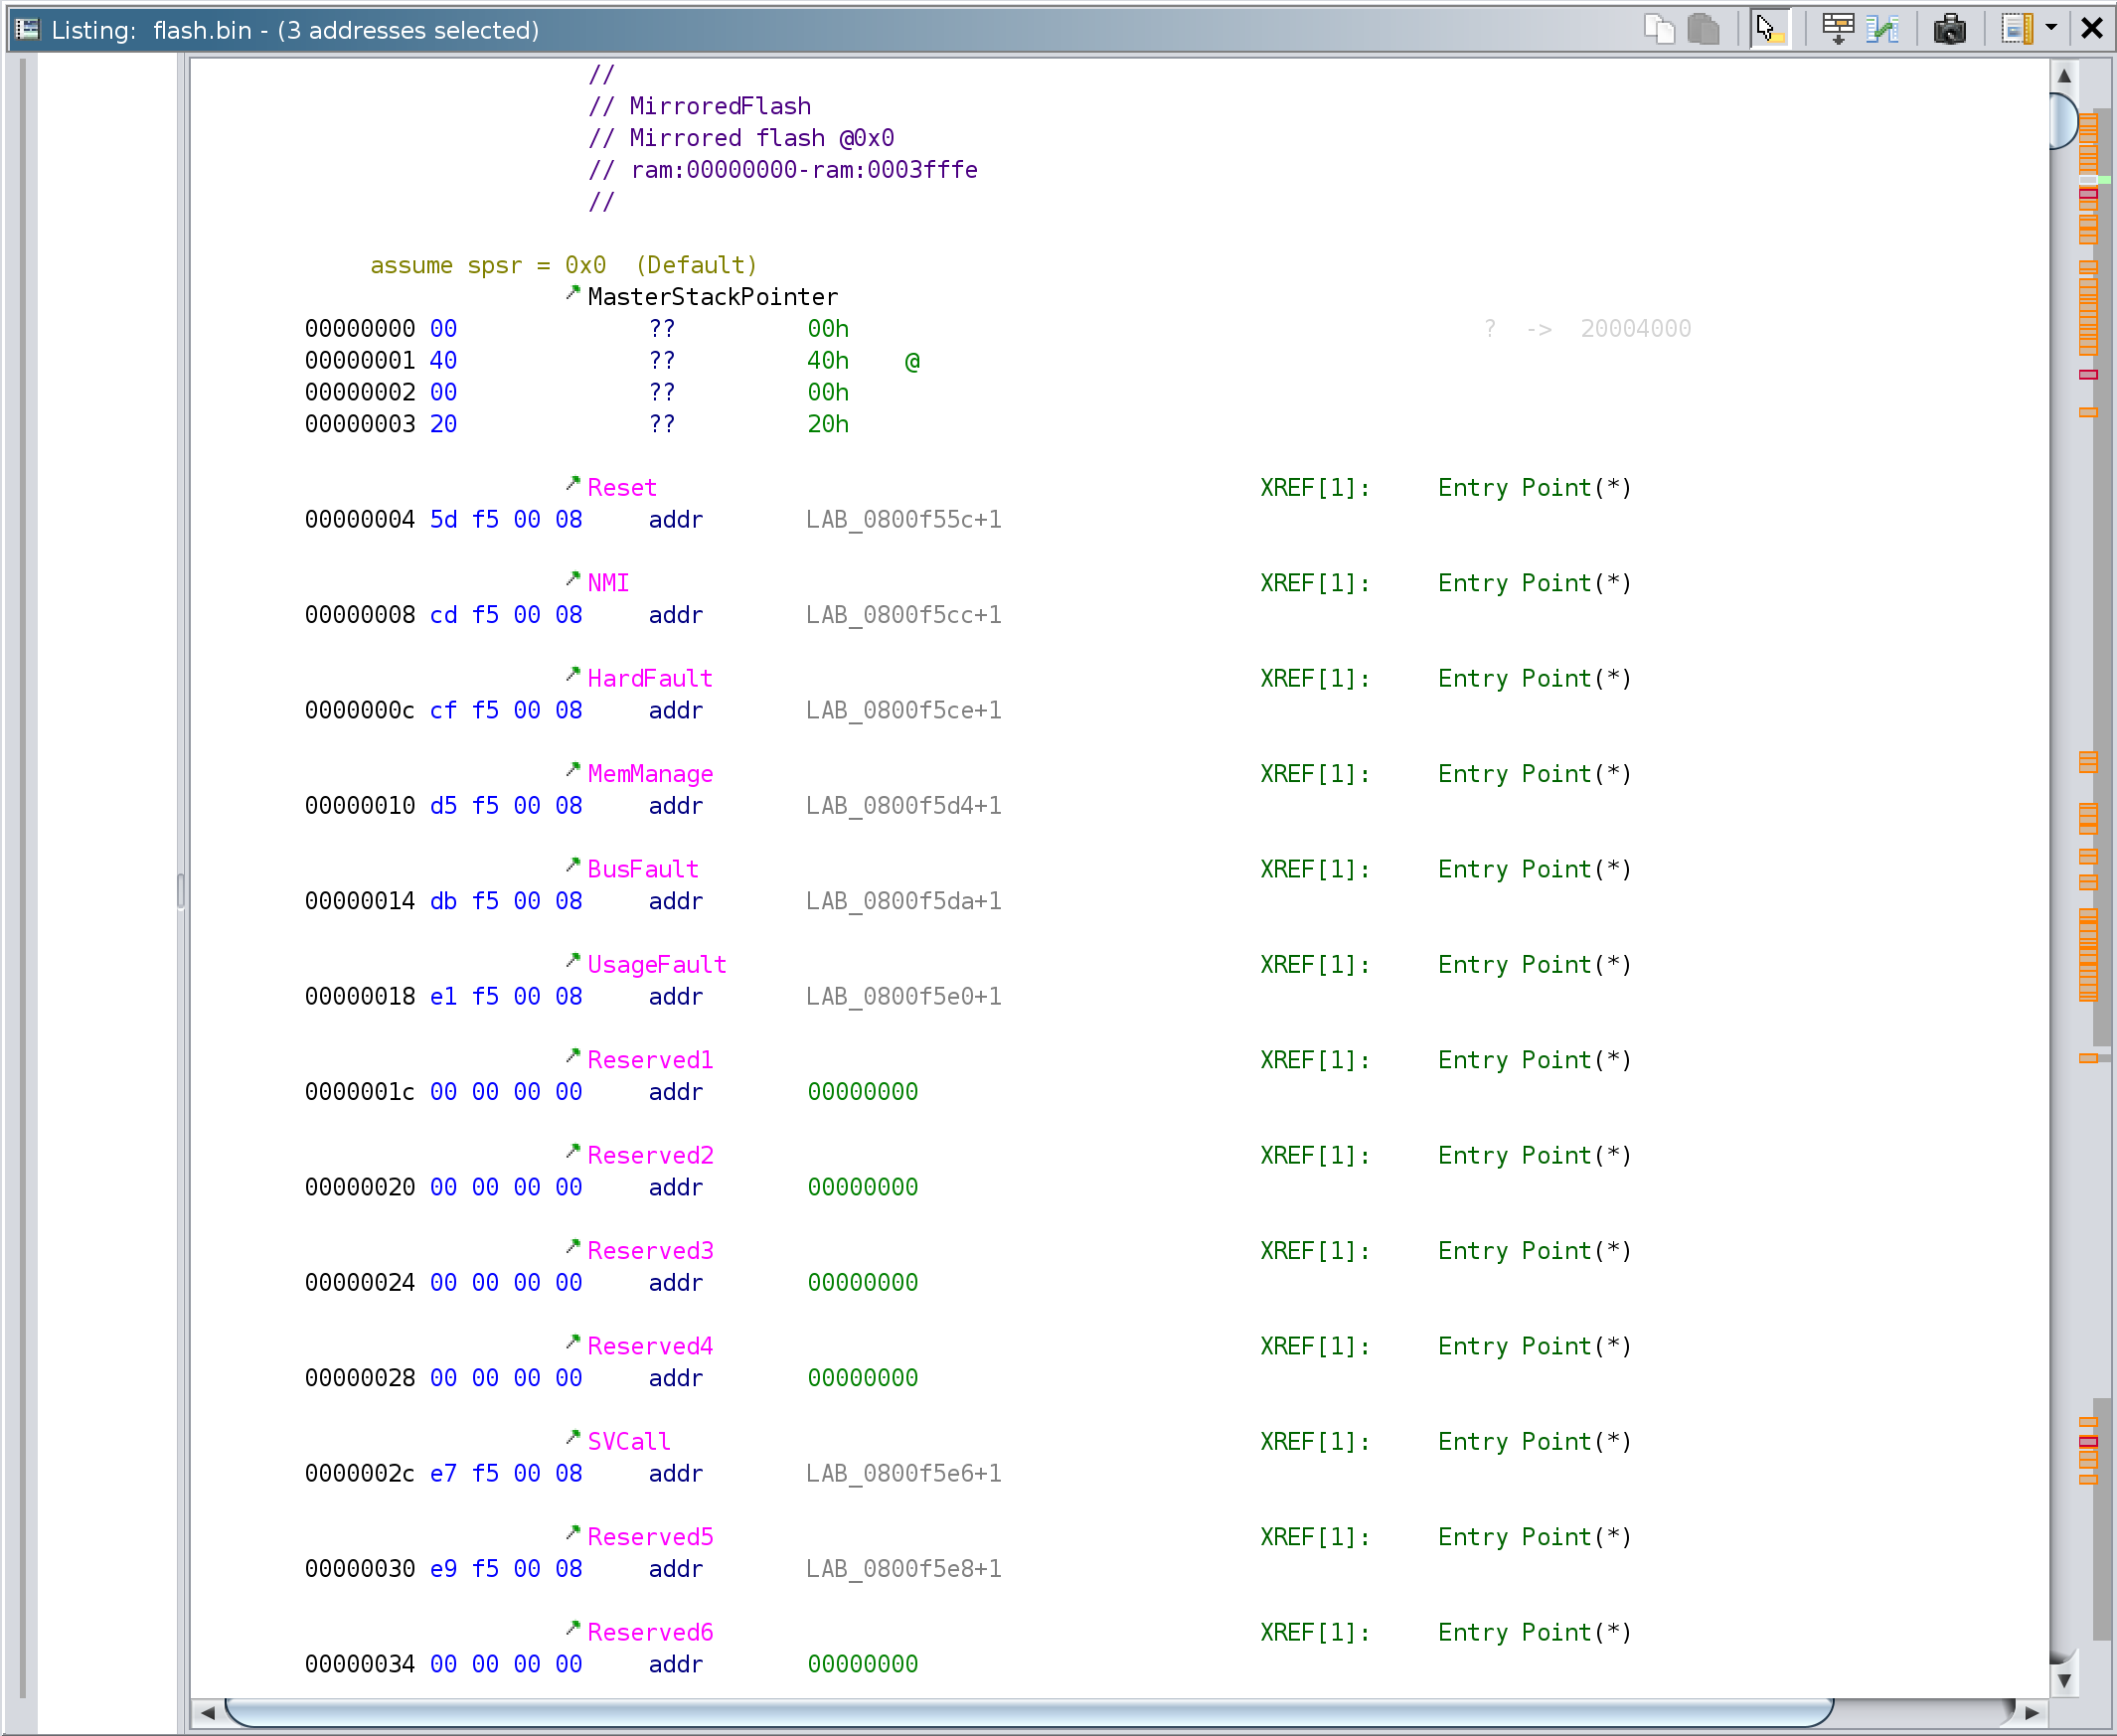
The vector table looks as I would expect and the +1 on the labels shows that the thumb indicating LSB has been correctly identified. When the device starts or resets, the address contaiend within the Reset vector will be jumped to, so double clicking on the LAB_0800f55c+1 label will take us to that address.
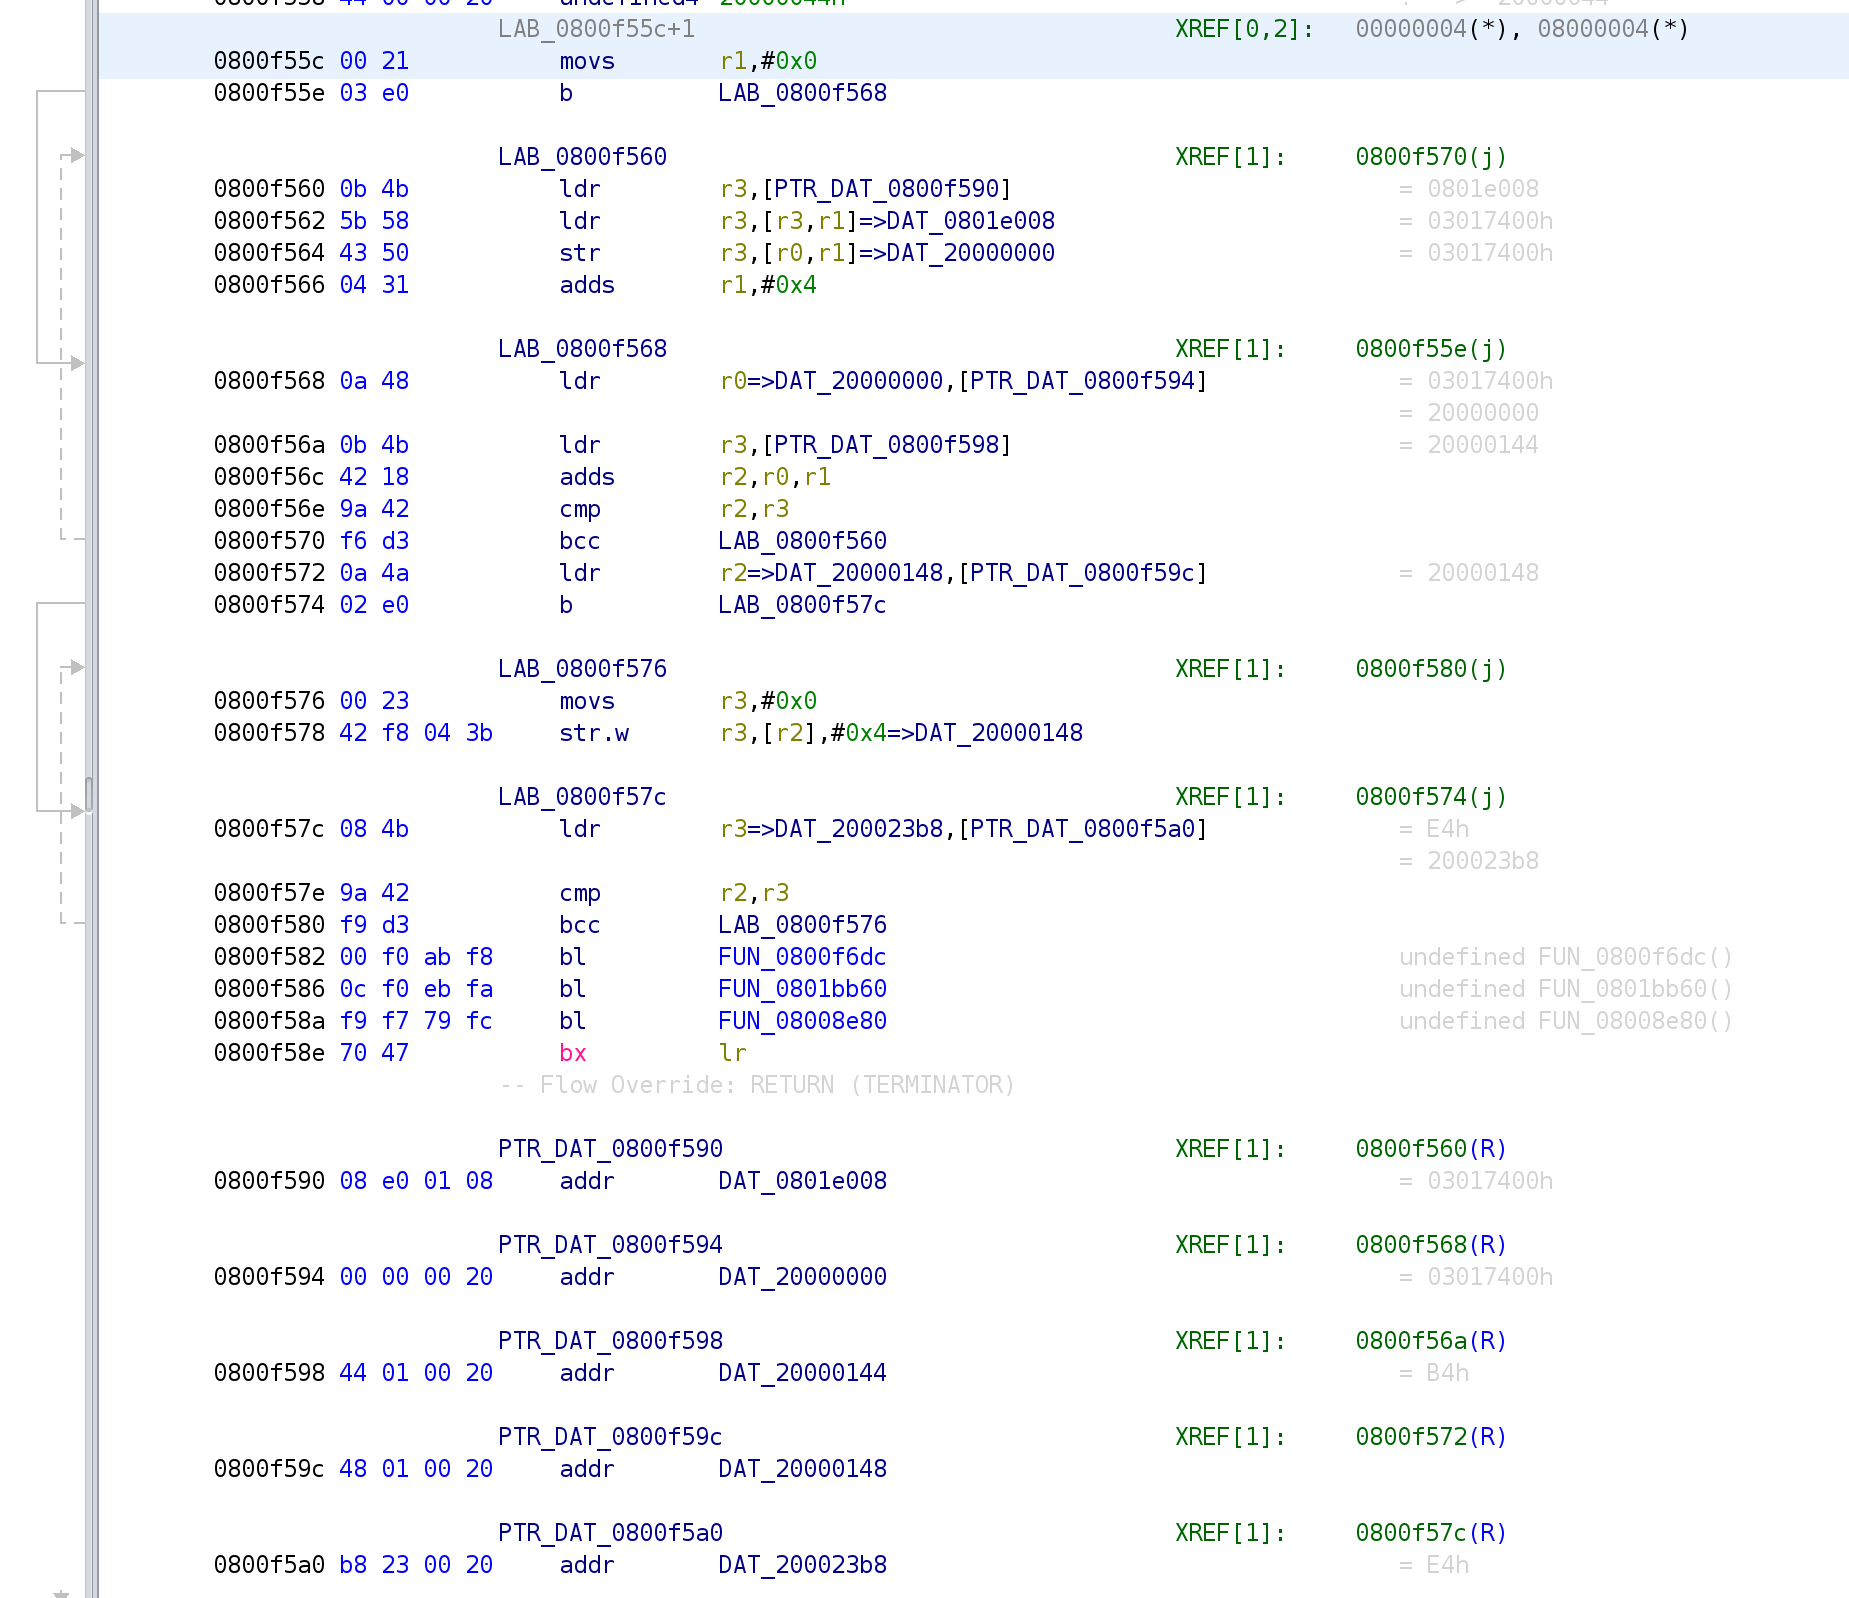
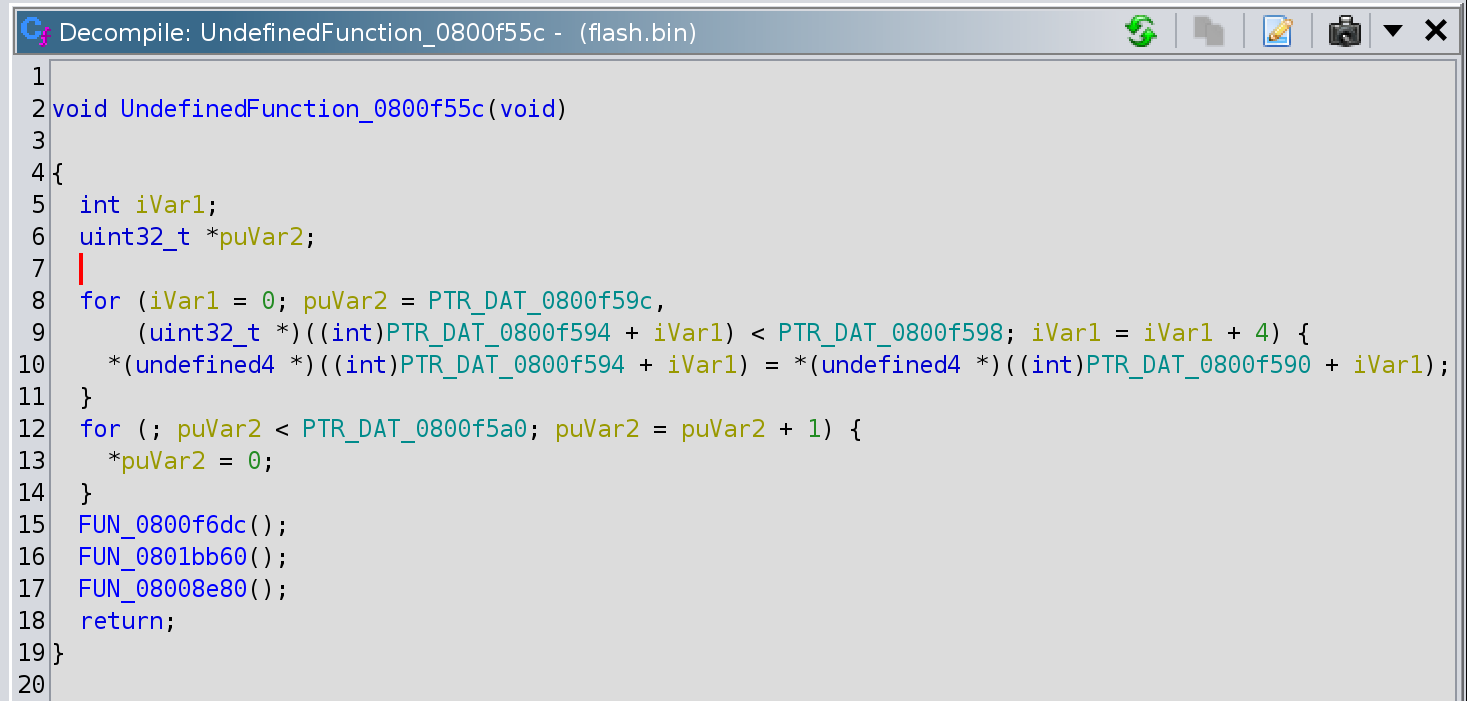
The address contains a simple call to set the stack pointer and then a jump to the next stage in the init. The arrows show the logic flow :-)
Helpfully Ghidra has also decompiled the opcodes into something more legible.
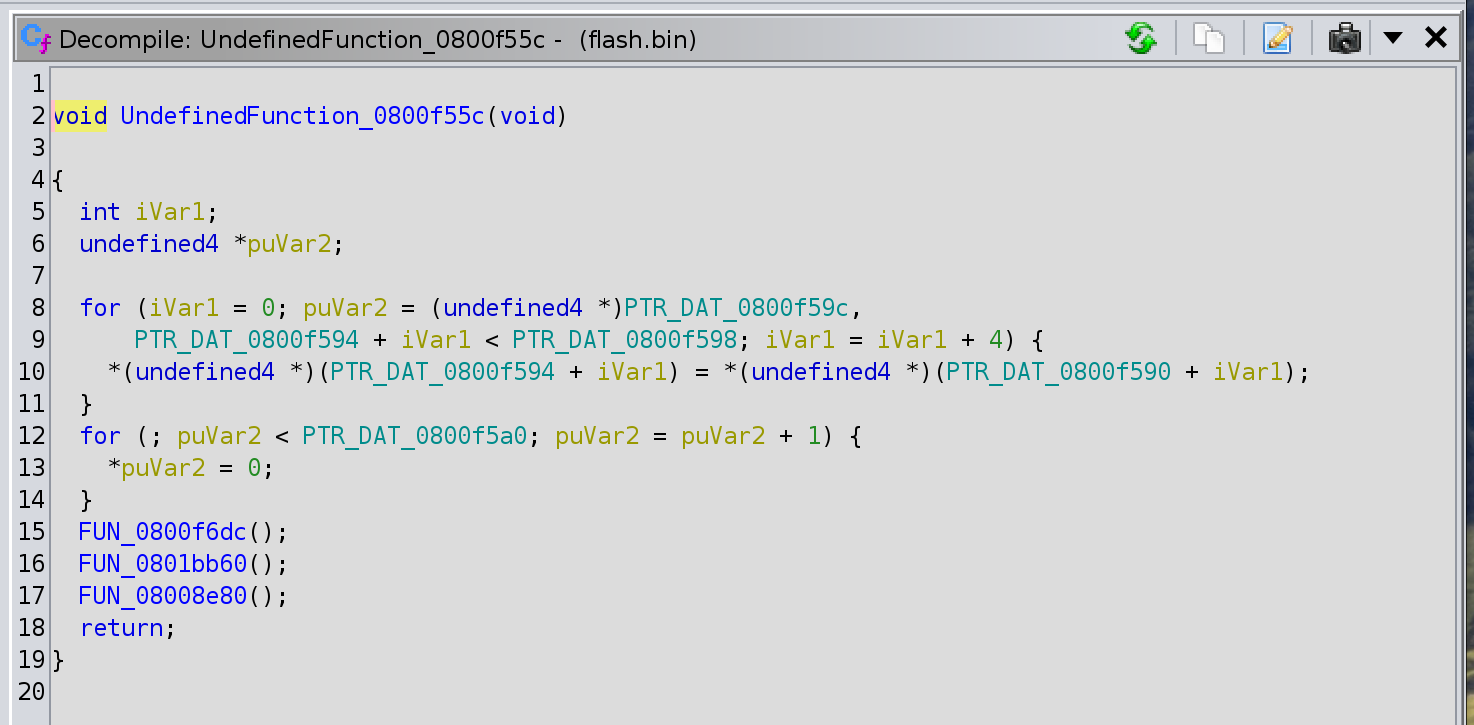
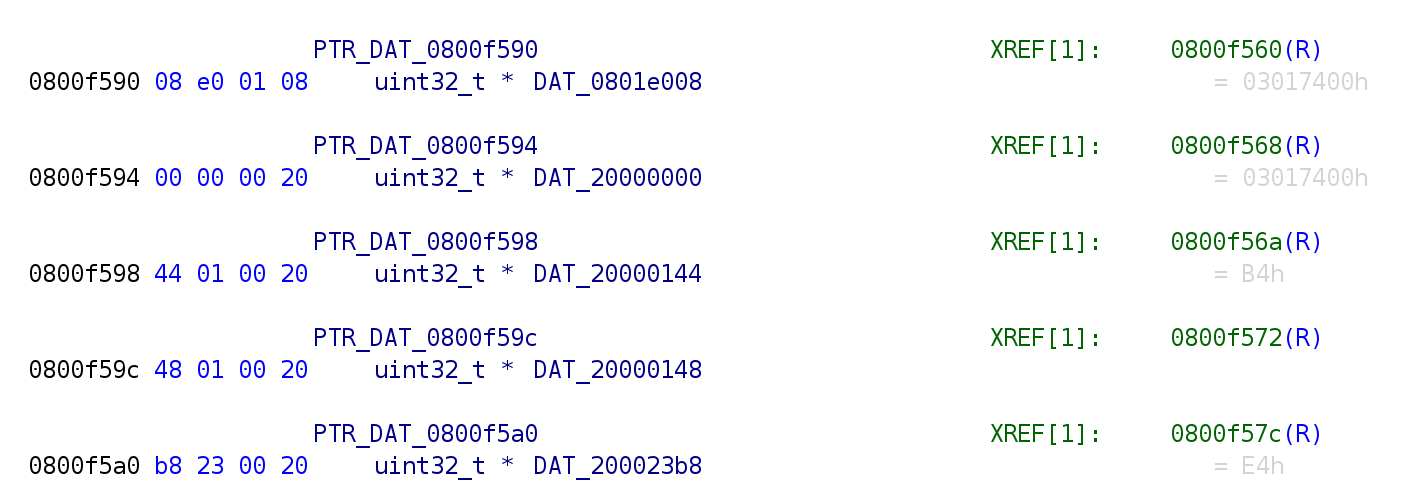
Essentially we copy bytes from 0x0801e008 into the start of the SRAM address space before zeroing out everything up to 0x200023b8 and then call some functions. Simples?
As I know that the DAT_ labels point to uint32_t variables, so I can change the type in the listing by highlighting the addr and pressing 't'. The change is then reflected in the decompiled function.
Double clicking on the FUN_0800f6dc function in the decompiled code pane moves the listing pane to the correct place and updates to show the decompiled code - as you would expect.
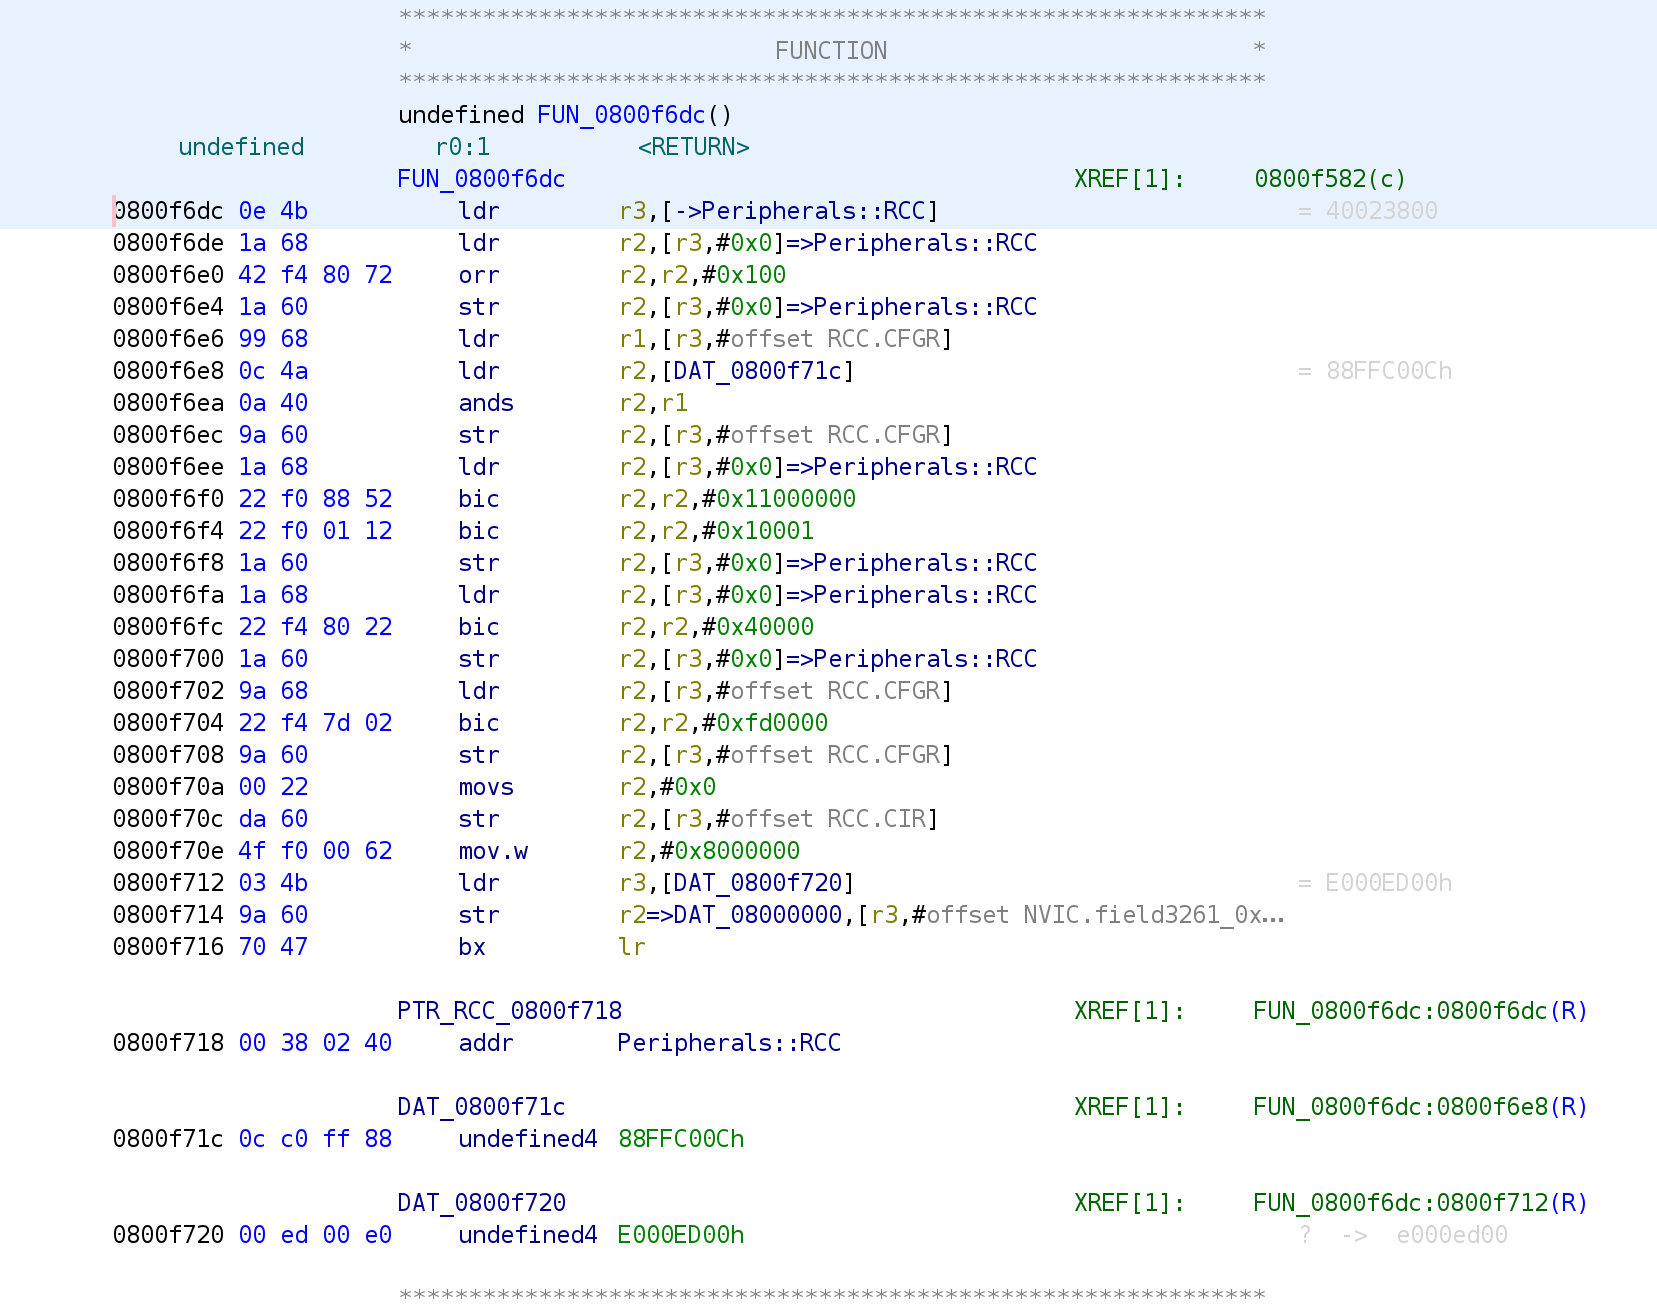
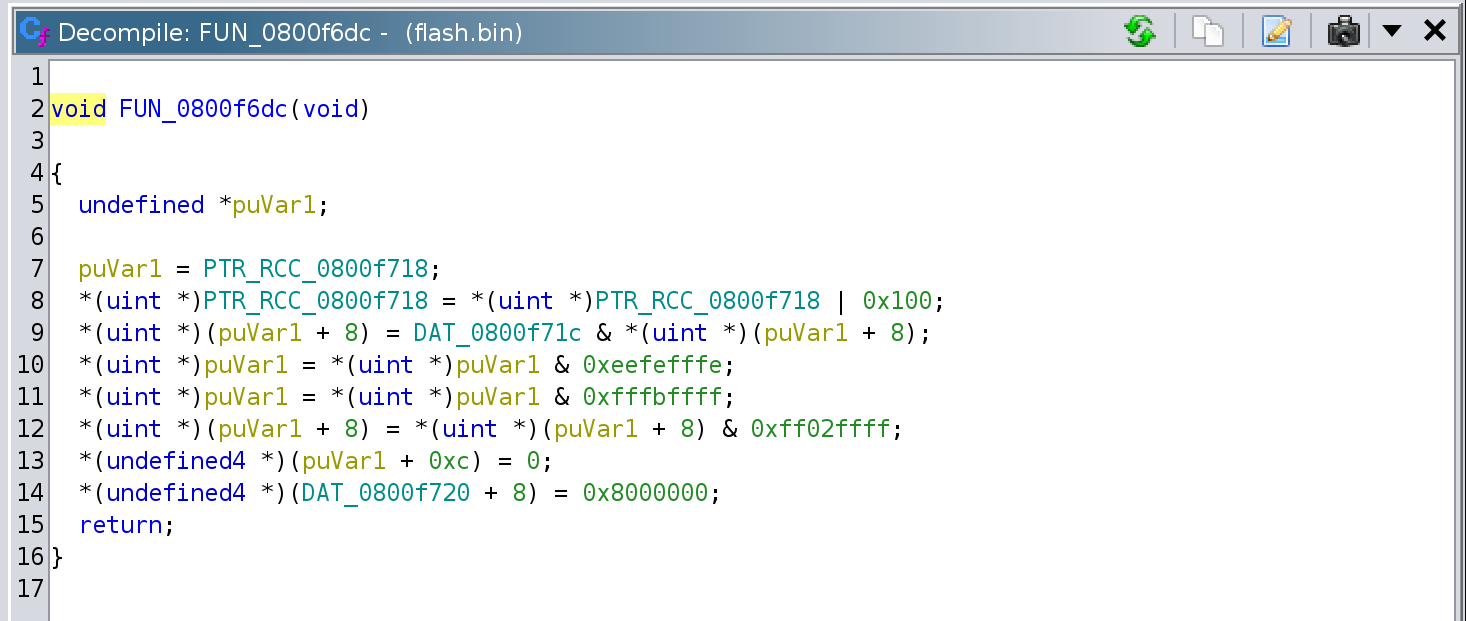
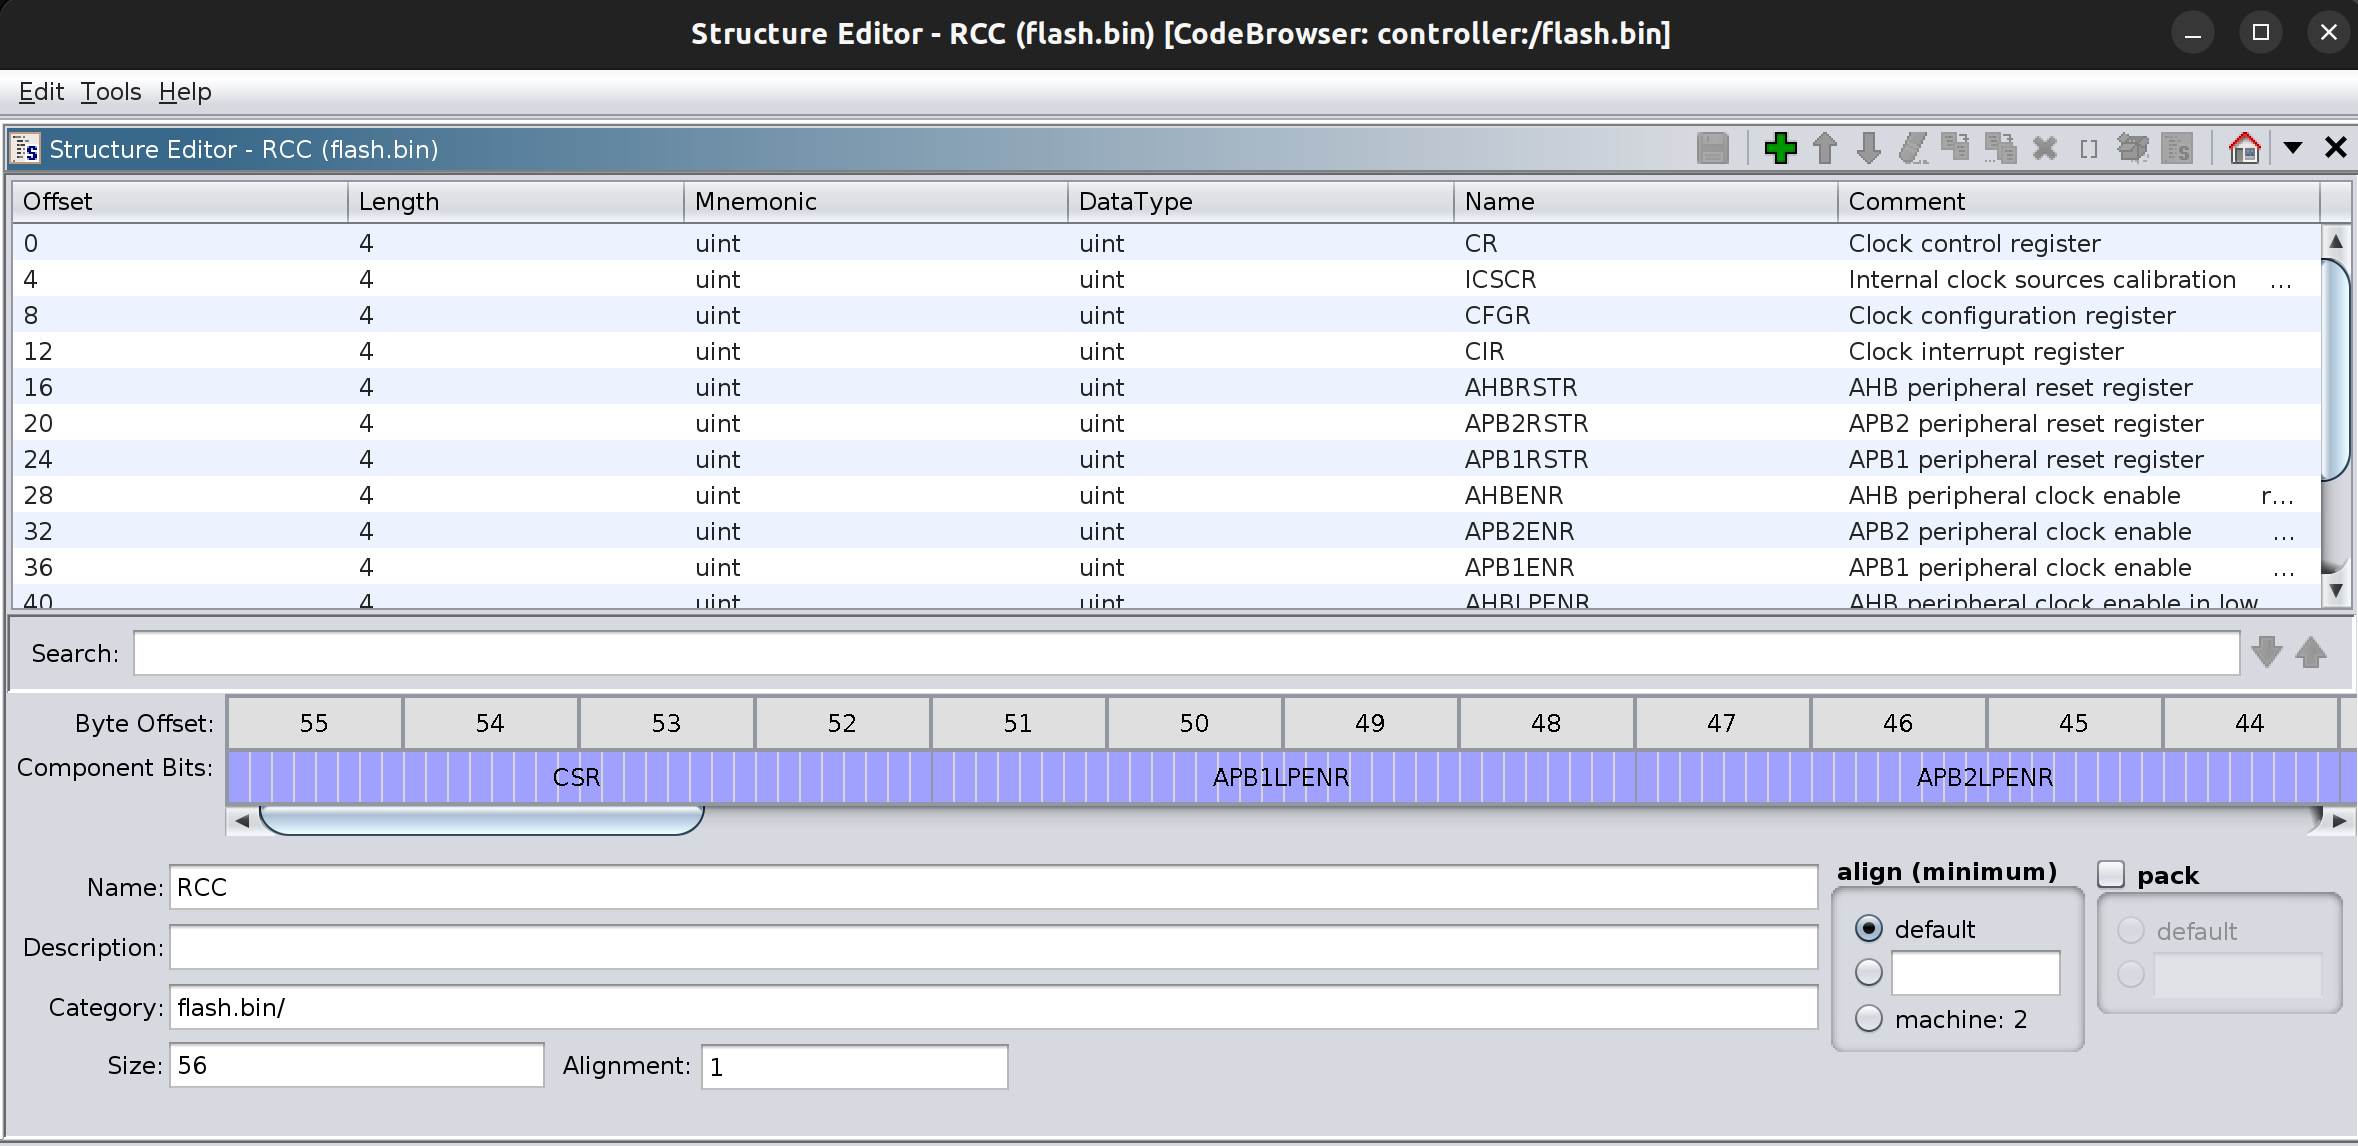
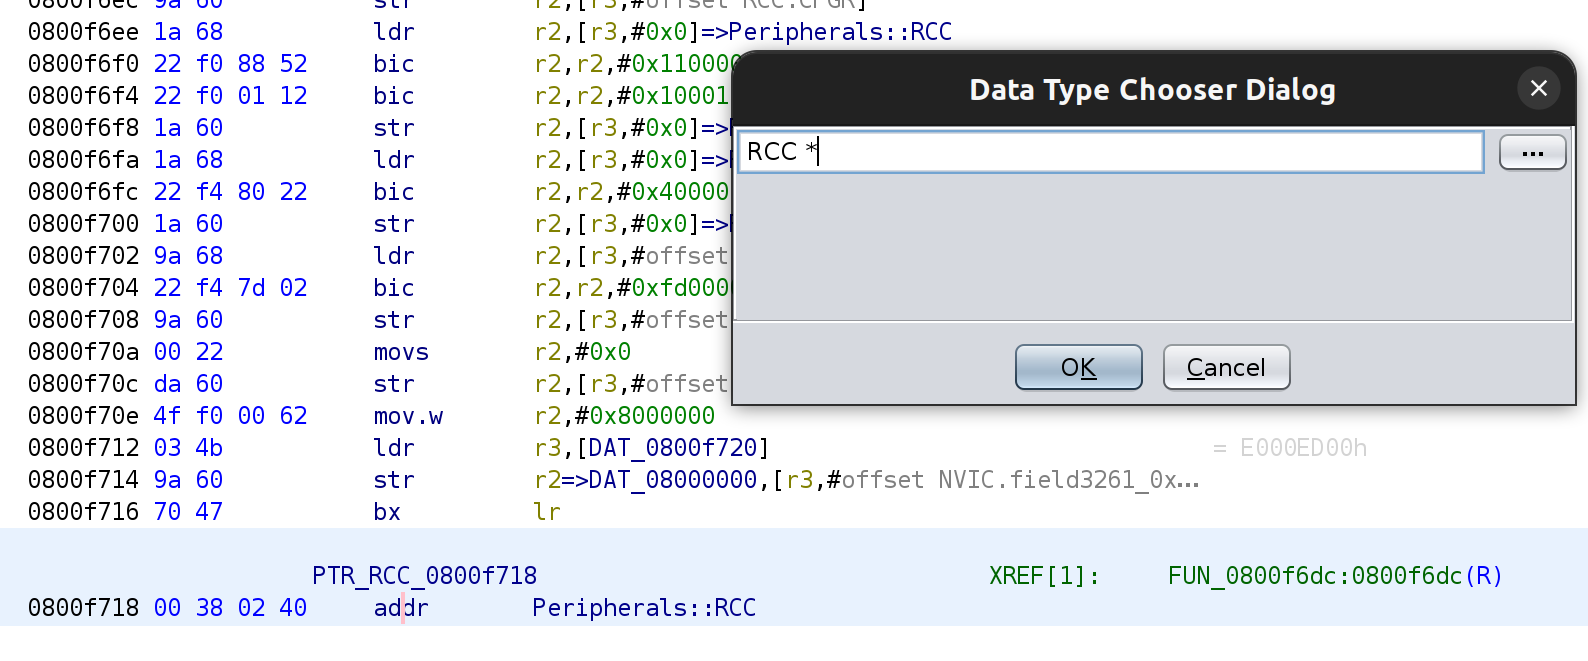
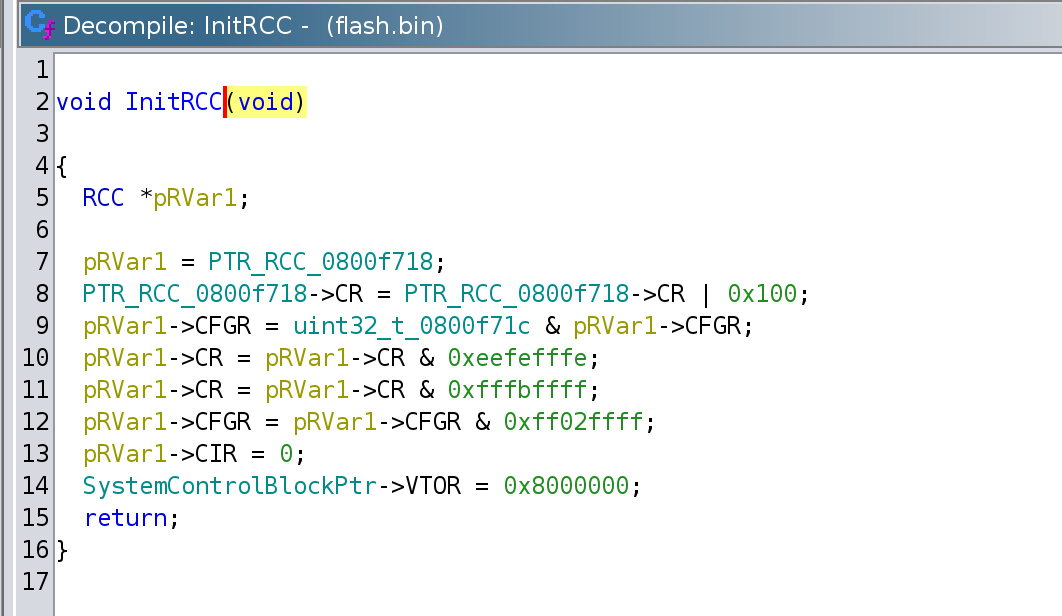
The PTR_RCC_0800f718 label is shown as being to Peripherals::RCC. As the decompiled code shows a lot of references to the pointer, it's likely they are all references to a structure - which in this case would be the RCC registers. Helpfully, there is an RCC type defined in the Data Type Manager so if we change the type in the listing pane, what happens?
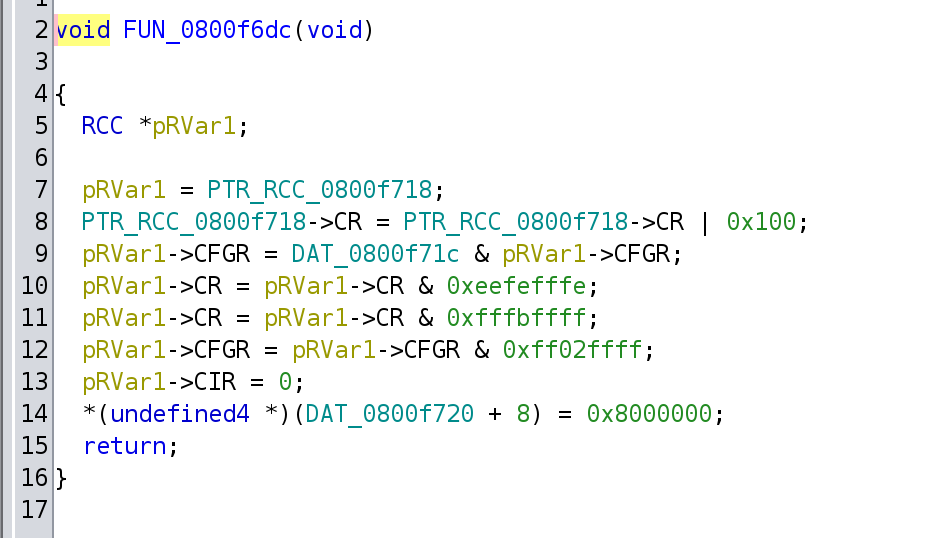
The decompiled code now makes far more sense. As the middle value is a constant and is used for a register value I assume that is a uint32_t and set the type as well. This caused the label to be changed to make it more obvious.
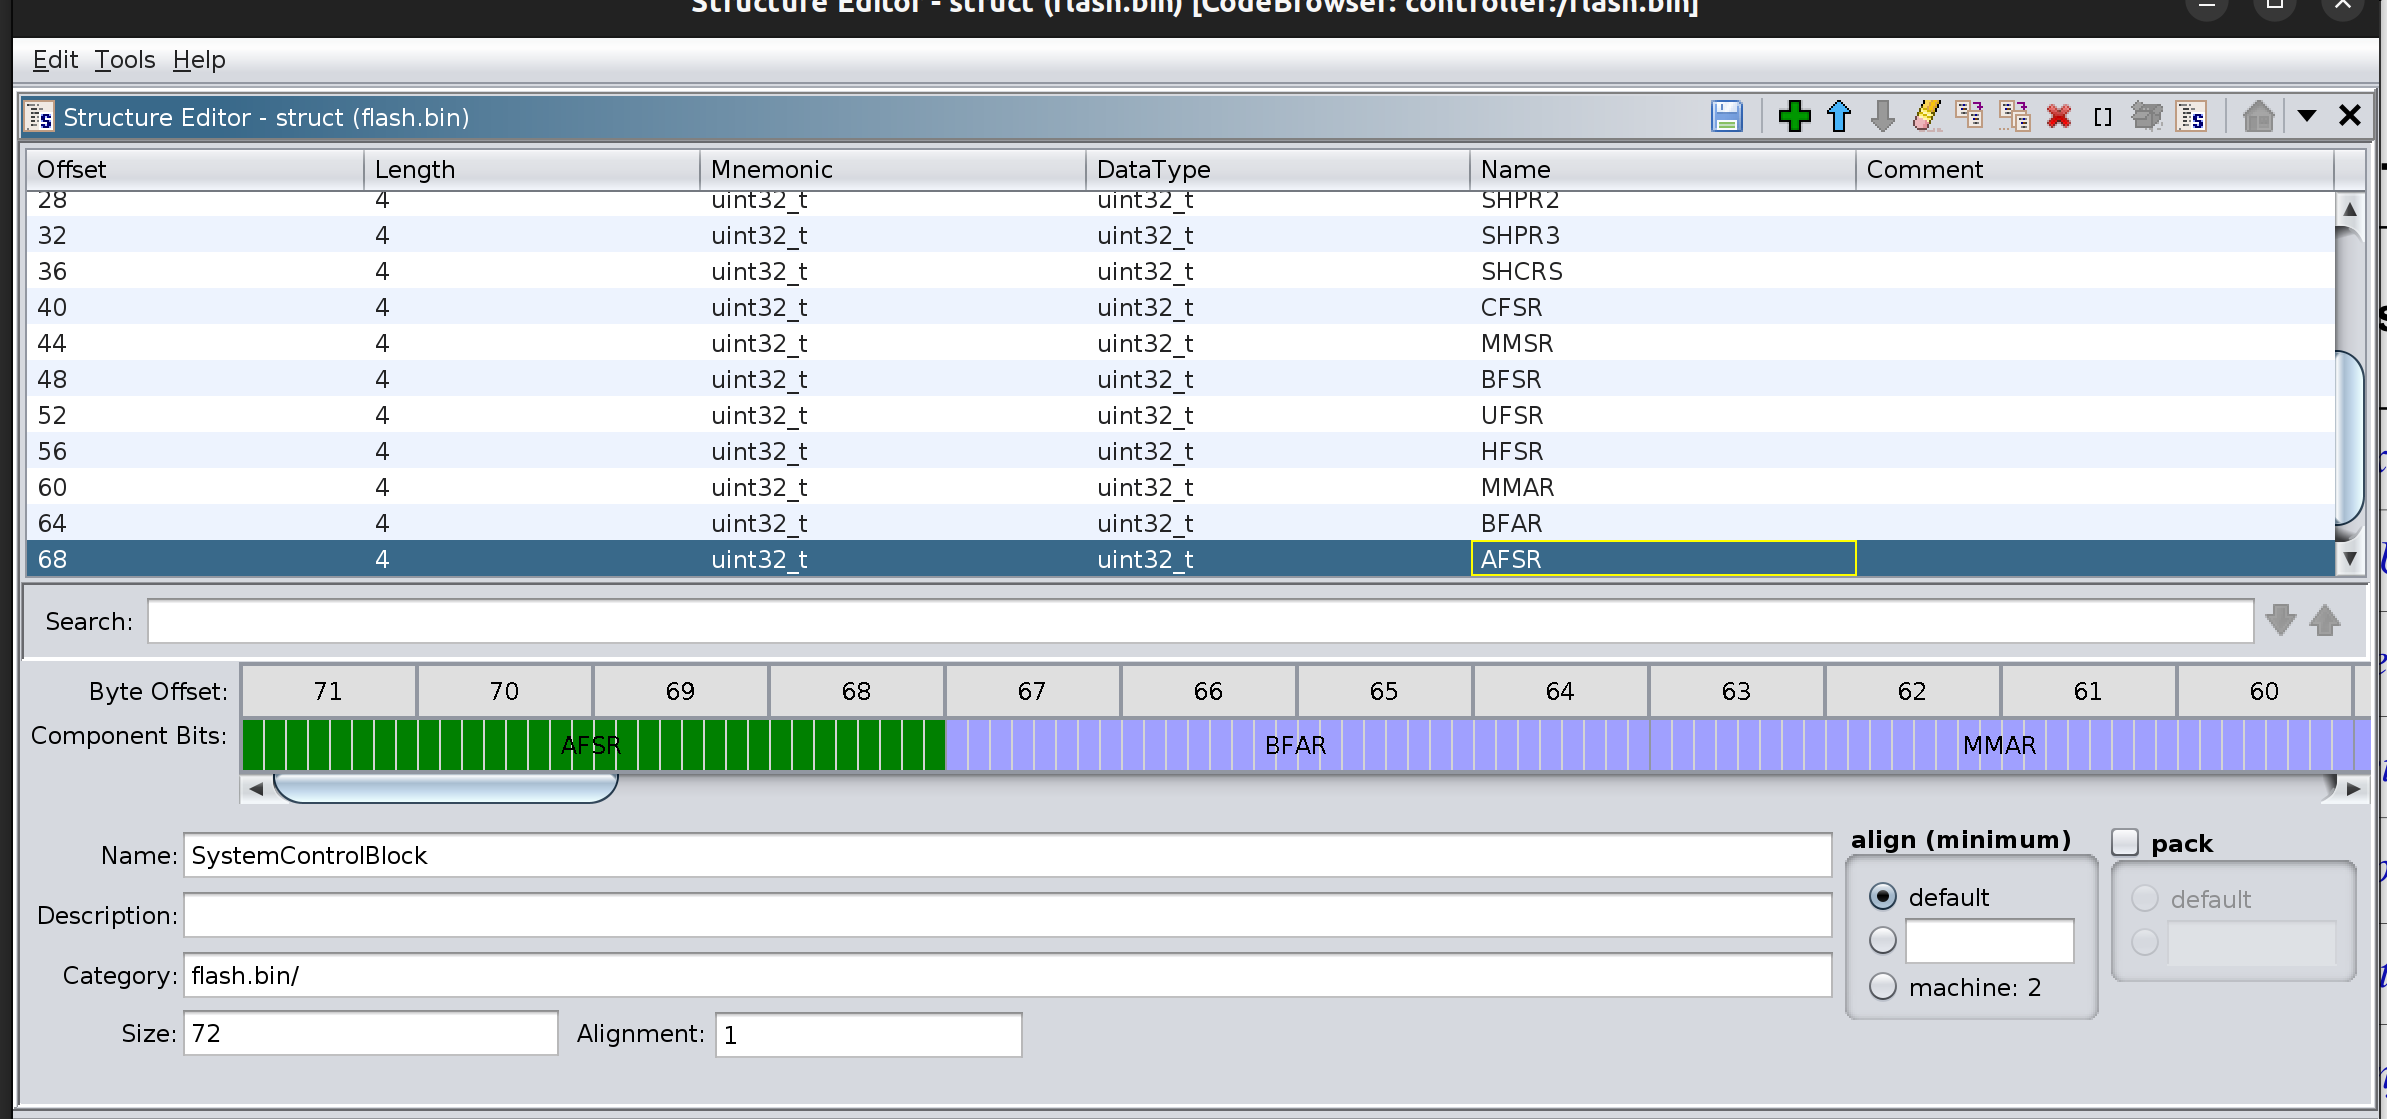
0xE000ED00?
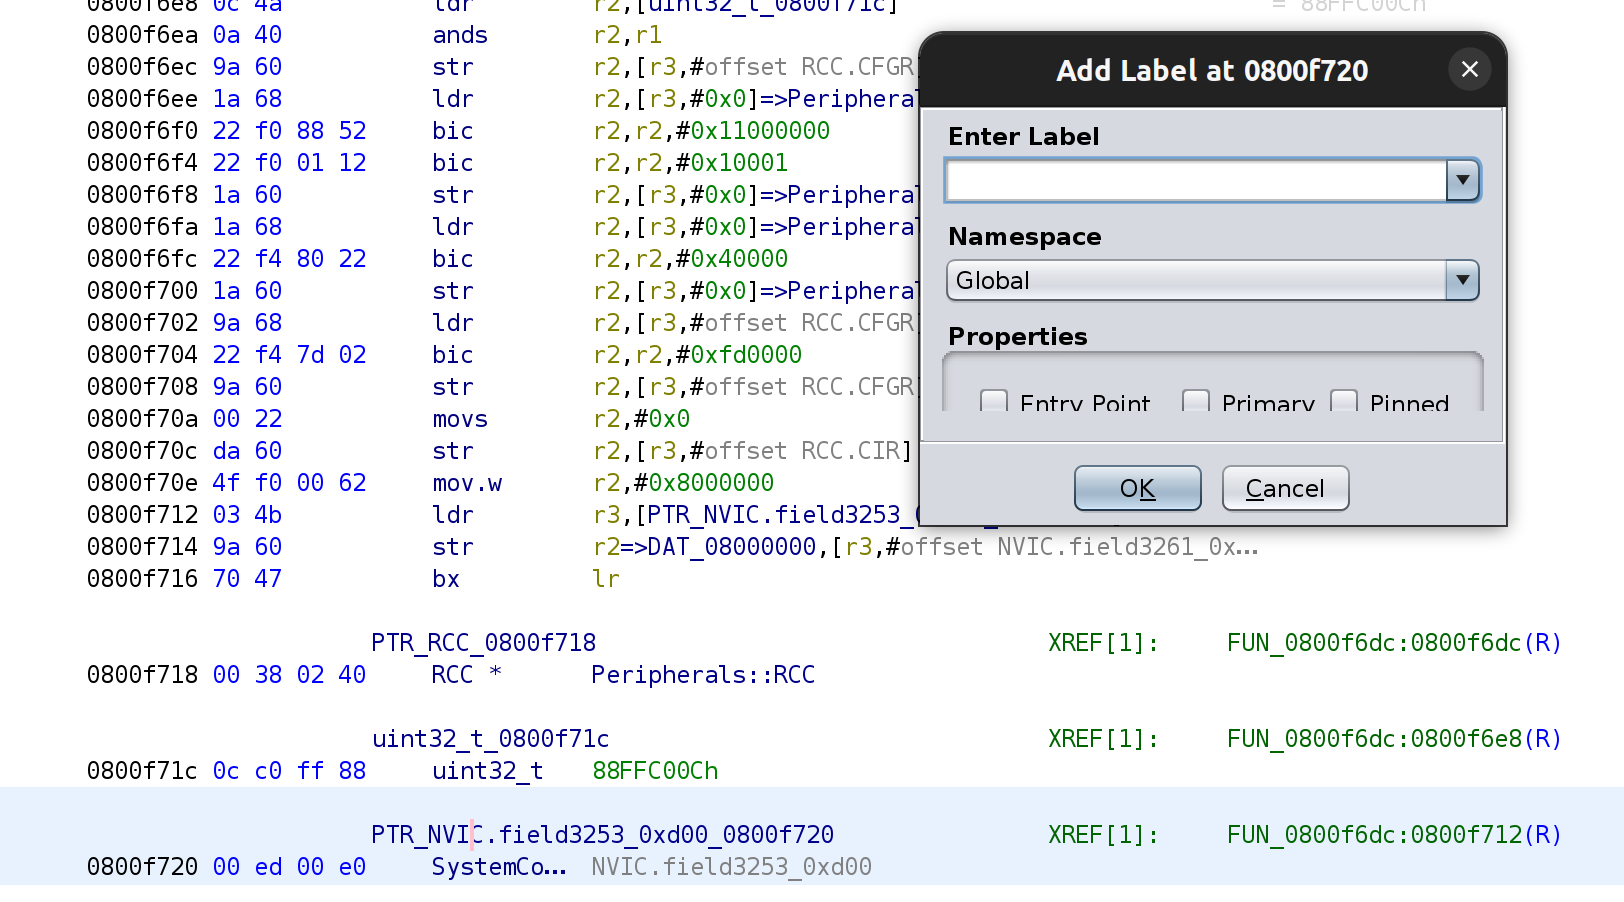
The address pointed to by DAT_0800F720, 0xE000ED00 is the start of the System Control Block registers. There is no data type defined for these but I can create one by using the context menu available for the filename in the Data Type Manager. I found this out after stumbling across this very useful series of blog articles :-)
Having created the data type I can change the type in the listing pane but to make the label friendlier to read I can also change the label assigned by using the 'l' key.
Finally the decompiled code looks far more legible! The label given to the function isn't really helpful, so using the 'l' key again when selecting it I changed to to something more suitable.
As to exactly what the code does - I'm not overly concerned at this point as it appears to be basic initialisation. Many such functions will exist and I'm trying hard to avoid being suckered down the rabbit hole of figuring out every tiny detail as there is a lot still to be done :-)
1500+?
There are over 1500 functions in the decompiled code and so I'm not sure that all of them are going to need this level of detailed work. I am basically interested in the RF messaging but have come to realise that unless I can figure out what's going on I have no chance of understanding the RF messages - which means I need to unpick a lot more of the decompiled code than I had hoped to.
One item working in may favour is that there appears to be a reasonable usage of the HAL libraries from STM which makes some of the decompiled code matchable and thus gives me filenames and arguments with which to start adding detail. I need to add a lot of the HAL structures but once added they should allow the decompiled code to be far easier to follow.